
New Report: Massachusetts Maintains Reasonable Debt Relative to GSP
Massachusetts is better-positioned to pay off its debts than other New England states. Recent reports show that the state’s liabilities equal 37.9 percent of its annual product, putting Massachusetts in a more stable position than most surrounding states (see figure 1).
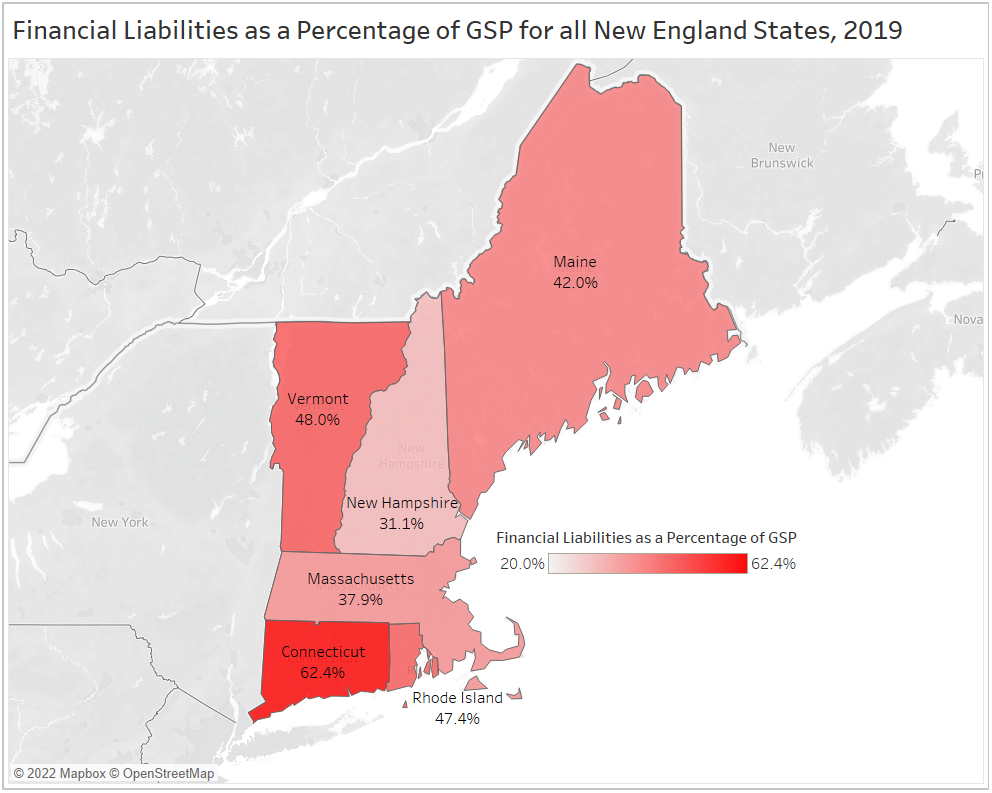
Figures 1 and 2: A map and corresponding table of the New England states showing the percentage of financial liabilities as a percentage of gross state product (GSP) by state. The author calculated financial liabilities as the sum of state debt, unpaid pension liabilities, and other post-employment benefit liabilities. GSP is from the US Bureau of Economic Analysis, state debt is from the US Census Bureau, unpaid pension liabilities are from ALEC’s “Unaccountable and Unaffordable, 2020” report, and other post-employment benefit liabilities are from ALEC’s “Other Post-Employment Benefits Liabilities: 5th Edition.”
Background
Recent reports from the American Legislative Exchange Council (ALEC), as well as data from the US Census Bureau show that in 2019 Massachusetts ranked second best among New England states for combined debt and unfunded liabilities as a percentage of gross state product (GSP). While the Bay State’s finances could be better, its massive GSP relative to other New England states shows that Massachusetts is well-positioned to pay its debts.
This analysis combines three metrics of state liabilities: state debt, unfunded pension liabilities, and other unfunded post-employment benefit (OPEB) liabilities. Massachusetts is responsible for eventually covering these costs. Pensions and OPEB liabilities are both debts the state owes to its former employees.
While the state may never actually pay off the debts in full, the amount of liability matters. The accumulation of debt drains the state budget because the state has to make regular interest payments. The state must also fund its pension and employment benefits systems to avoid a future crisis where the state cannot cover the costs of pensions.
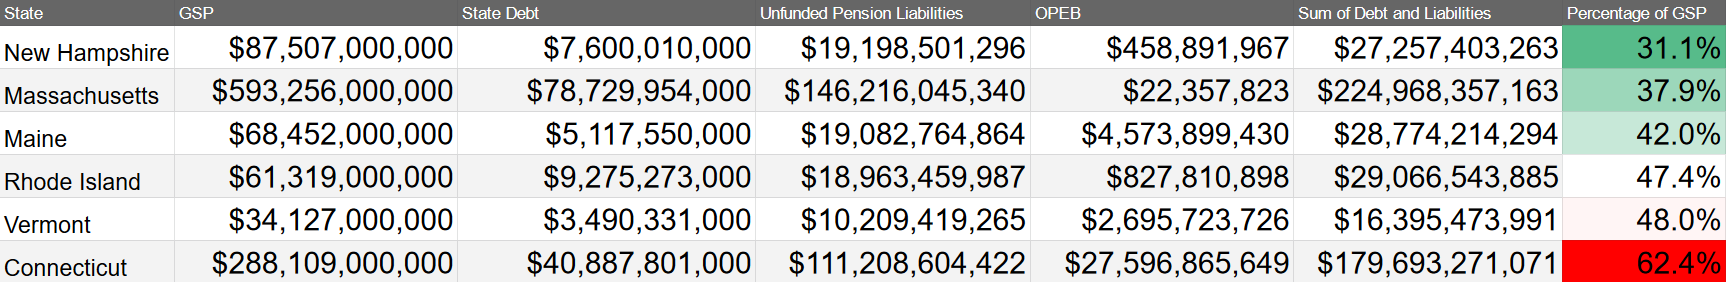
Figure 2: A table showing state liabilities and GSP. See the caption of figure 1 for details and sources. The author calculated “Sum of Debt and Liabilities” by adding together “State Debt,” “Unfunded Pension Liabilities,” and “OPEB.”
GSP is the standard metric by which to compare these types of liabilities. GSP shows the state’s ability to pay off a debt because it represents the state’s economic output. States with large productive workforces are naturally more able to pay their debts because they generate more revenue.
Analysis
While Massachusetts has New England’s highest state debt and unfunded pension liabilities, its relatively massive GSP shows that the state can likely cover its debts.
An economic downturn could have a major impact on the state’s ability to pay its debt. When GSP decreases and if the state tries to enact stimulus spending to bolster the economy, it would have a dramatic impact on the liabilities-to-GSP ratio. It is important for Massachusetts to pay down its debts and fund pension programs now, while revenue is high. Otherwise, Massachusetts could quickly find itself in hot water.
Overall, Massachusetts is doing well, but the state must prioritize paying down its debt and funding its liabilities before the next economic downturn hits.
Other New England States
Connecticut is a case study in how taking on too much debt can backfire. Throughout the past decade Connecticut has experienced a decline in its economic output as job growth has stagnated (see Figure 3). This has caused their ability to pay their debt to decrease dramatically and thrown their finances into disarray. This problem, alongside mismanagement, has caused the state to have the worst liabilities-to-GSP ratio of any New England state and probably any state in the country.
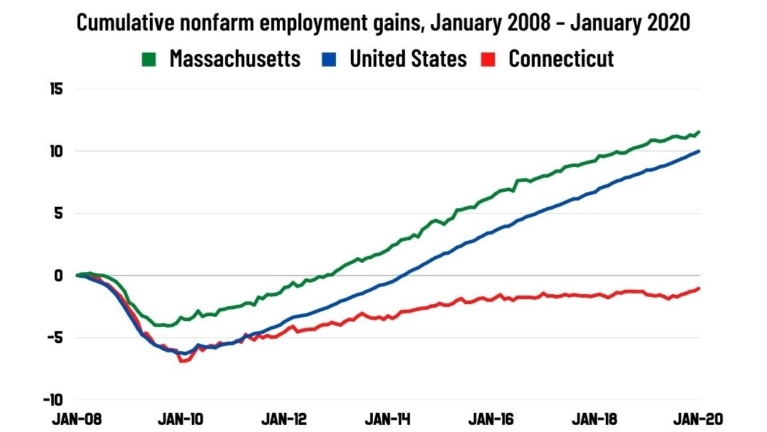
Figure 3: Connecticut job growth has stagnated relative to the national average over the past decade, contributing to their dismal liabilities-to-GSP ratio. This graphic is taken directly from the Pioneer Institute’s latest book “Back to Taxachusetts” (page 24).
Vermont also appears to be in a difficult situation. Even though Vermont’s state debt is less than 4 percent that of Massachusetts, its GSP is so small that it will be more difficult for them to pay back their debt than Massachusetts.
The international rule-of-thumb for debt to GDP ratio is to keep it below 100 percent in order to prevent financial catastrophe. The United States federal government debt-to-GDP ratio is currently 134 percent.
About the Author: Joseph Staruski is a government transparency intern with the Pioneer Institute. He is currently a Master of Public Policy Student at the University of Massachusetts, Amherst. He was previously an opinions columnist with the Boston College student newspaper, The Heights, and an Intern with the Philadelphia Public School Notebook. He has a BA in Philosophy and the Growth and Structure of Cities from Haverford College. Feel free to reach out via email, LinkedIn, or write a letter to Pioneer’s Office in Boston.

