
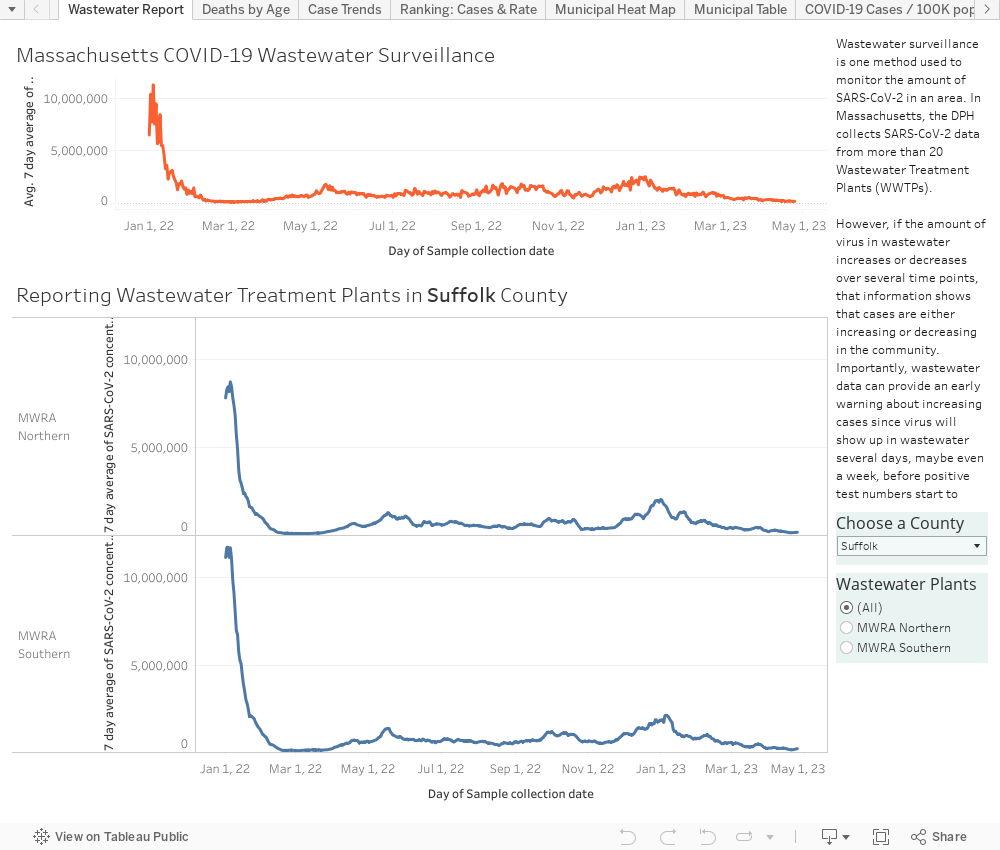
Mapping COVID-19 in Massachusetts Cities & Towns
Kudos to the Baker Administration for providing transparency in a critical matter of public safety. As Pioneer Institute’s Senior Fellow in Healthcare, Barbara Anthony, urged in The Boston Globe, the Massachusetts Department of Public Health upped its game and started posting the count and rate (per 100,000) of confirmed COVID-19 Cases in Massachusetts by City/Town. They will update the numbers each Wednesday. https://www.mass.gov/info-details/covid-19-cases-quarantine-and-monitoring
Taking this data, Pioneer created different ways to view the data:
-
- Scatter charts – Showing cases by population, with and without Boston (which is the outlier).
- Rankings – Largest to smallest number of cases and rate (cases per 100K population)
- Heat Maps – Of the infection rate, by county and municipality
- Table – By municipality & county, of the total number of cases, rate of infection, and the population (for reference)
- Testing – Graphs, a table and map showing number of people tested, testing rate per 100K population, and percent of positive tests.
Note: For populations <50,000, <5 cases are reported as such or suppressed for confidentiality purposes. In our graphs and tables, for those small towns with some reported cases, we assigned them 3 cases so the maps would draw correctly.
We plan to update the maps during the crisis after DPH releases weekly data.
Get Our COVID-19 News, Tips & Resources!
 https://pioneerinstitute.org/wp-content/uploads/Jamie-Gass-Education-Resources-Blog-Banner-7.png
250
700
Jamie Gass
https://pioneerinstitute.org/wp-content/uploads/logo_440x96.png
Jamie Gass2021-07-27 10:28:332021-07-27 12:12:57Jeeves & Wooster’s World The Comic Genius of P.G. Wodehouse – 30 Resources for Parents & Students
https://pioneerinstitute.org/wp-content/uploads/Jamie-Gass-Education-Resources-Blog-Banner-7.png
250
700
Jamie Gass
https://pioneerinstitute.org/wp-content/uploads/logo_440x96.png
Jamie Gass2021-07-27 10:28:332021-07-27 12:12:57Jeeves & Wooster’s World The Comic Genius of P.G. Wodehouse – 30 Resources for Parents & Students https://pioneerinstitute.org/wp-content/uploads/Statehouse-e1580417570863.jpg
683
1024
Editorial Staff
https://pioneerinstitute.org/wp-content/uploads/logo_440x96.png
Editorial Staff2021-07-26 09:33:372021-08-10 11:09:22Public Statement on the MA Legislature’s Blanket Pension Giveaway
https://pioneerinstitute.org/wp-content/uploads/Statehouse-e1580417570863.jpg
683
1024
Editorial Staff
https://pioneerinstitute.org/wp-content/uploads/logo_440x96.png
Editorial Staff2021-07-26 09:33:372021-08-10 11:09:22Public Statement on the MA Legislature’s Blanket Pension Giveaway https://pioneerinstitute.org/wp-content/uploads/scott-graham-5fNmWej4tAA-unsplash-scaled.jpg
1709
2560
Nathan Bornstein
https://pioneerinstitute.org/wp-content/uploads/logo_440x96.png
Nathan Bornstein2021-07-22 11:09:592021-08-10 11:32:24Employment trends in the Greater Boston Area and Touristy Massachusetts Counties during the COVID-19 Pandemic
https://pioneerinstitute.org/wp-content/uploads/scott-graham-5fNmWej4tAA-unsplash-scaled.jpg
1709
2560
Nathan Bornstein
https://pioneerinstitute.org/wp-content/uploads/logo_440x96.png
Nathan Bornstein2021-07-22 11:09:592021-08-10 11:32:24Employment trends in the Greater Boston Area and Touristy Massachusetts Counties during the COVID-19 Pandemic https://pioneerinstitute.org/wp-content/uploads/Landsiedel-Pioneer-Institute-Blog-6-Featured-Image.png
500
1000
Jack Landsiedel
https://pioneerinstitute.org/wp-content/uploads/logo_440x96.png
Jack Landsiedel2021-07-20 12:00:222021-07-20 12:00:56The COVID-19 Impact on Massachusetts Community College Enrollment & Success Trends
https://pioneerinstitute.org/wp-content/uploads/Landsiedel-Pioneer-Institute-Blog-6-Featured-Image.png
500
1000
Jack Landsiedel
https://pioneerinstitute.org/wp-content/uploads/logo_440x96.png
Jack Landsiedel2021-07-20 12:00:222021-07-20 12:00:56The COVID-19 Impact on Massachusetts Community College Enrollment & Success Trends https://pioneerinstitute.org/wp-content/uploads/Untitled-design-29-2.png
600
1900
Jamie Gass
https://pioneerinstitute.org/wp-content/uploads/logo_440x96.png
Jamie Gass2021-07-19 15:19:382021-07-19 15:19:38Elevating Liberal Democracy Above Fragmentation – 30 Resources for Citizens and Schools
https://pioneerinstitute.org/wp-content/uploads/Untitled-design-29-2.png
600
1900
Jamie Gass
https://pioneerinstitute.org/wp-content/uploads/logo_440x96.png
Jamie Gass2021-07-19 15:19:382021-07-19 15:19:38Elevating Liberal Democracy Above Fragmentation – 30 Resources for Citizens and Schools https://pioneerinstitute.org/wp-content/uploads/image001-17.jpg
600
900
Jamie Gass
https://pioneerinstitute.org/wp-content/uploads/logo_440x96.png
Jamie Gass2021-07-13 11:24:432021-07-13 11:26:38“Hellhound on My Trail” Celebrating American Blues Music – 35 Resources for Students
https://pioneerinstitute.org/wp-content/uploads/image001-17.jpg
600
900
Jamie Gass
https://pioneerinstitute.org/wp-content/uploads/logo_440x96.png
Jamie Gass2021-07-13 11:24:432021-07-13 11:26:38“Hellhound on My Trail” Celebrating American Blues Music – 35 Resources for Students https://pioneerinstitute.org/wp-content/uploads/pexels-matthias-zomer-339620-1.jpg
1440
2560
Nathan Bornstein
https://pioneerinstitute.org/wp-content/uploads/logo_440x96.png
Nathan Bornstein2021-07-08 12:03:072021-08-10 11:40:14Why did some nursing homes experience more COVID-19 deaths and infections than others?
https://pioneerinstitute.org/wp-content/uploads/pexels-matthias-zomer-339620-1.jpg
1440
2560
Nathan Bornstein
https://pioneerinstitute.org/wp-content/uploads/logo_440x96.png
Nathan Bornstein2021-07-08 12:03:072021-08-10 11:40:14Why did some nursing homes experience more COVID-19 deaths and infections than others? https://pioneerinstitute.org/wp-content/uploads/Guest-christina-qi-12.png
1570
3000
Editorial Staff
https://pioneerinstitute.org/wp-content/uploads/logo_440x96.png
Editorial Staff2021-07-08 11:15:162021-07-08 11:38:43Ely Kaplansky Goes from Immigrant to Inc. 5000 Insurance Entrepreneur
https://pioneerinstitute.org/wp-content/uploads/Guest-christina-qi-12.png
1570
3000
Editorial Staff
https://pioneerinstitute.org/wp-content/uploads/logo_440x96.png
Editorial Staff2021-07-08 11:15:162021-07-08 11:38:43Ely Kaplansky Goes from Immigrant to Inc. 5000 Insurance Entrepreneur https://pioneerinstitute.org/wp-content/uploads/Copy-of-TLC-template-19.png
512
1024
Editorial Staff
https://pioneerinstitute.org/wp-content/uploads/logo_440x96.png
Editorial Staff2021-07-07 08:34:402023-08-26 10:39:36Aurora Institute’s Susan Patrick on Digital Learning Lessons from COVID-19
https://pioneerinstitute.org/wp-content/uploads/Copy-of-TLC-template-19.png
512
1024
Editorial Staff
https://pioneerinstitute.org/wp-content/uploads/logo_440x96.png
Editorial Staff2021-07-07 08:34:402023-08-26 10:39:36Aurora Institute’s Susan Patrick on Digital Learning Lessons from COVID-19 https://pioneerinstitute.org/wp-content/uploads/WordPress-Blog-Post-Featured-Image-22.png
512
1024
Jamie Gass
https://pioneerinstitute.org/wp-content/uploads/logo_440x96.png
Jamie Gass2021-07-04 10:13:052021-07-04 10:15:20Celebrating American Independence! – 50 Resources on America’s Founding for Schoolchildren & Citizens
https://pioneerinstitute.org/wp-content/uploads/WordPress-Blog-Post-Featured-Image-22.png
512
1024
Jamie Gass
https://pioneerinstitute.org/wp-content/uploads/logo_440x96.png
Jamie Gass2021-07-04 10:13:052021-07-04 10:15:20Celebrating American Independence! – 50 Resources on America’s Founding for Schoolchildren & Citizens https://pioneerinstitute.org/wp-content/uploads/Screen-Shot-2021-06-10-at-10.46.32-AM.png
516
920
Maida Raza
https://pioneerinstitute.org/wp-content/uploads/logo_440x96.png
Maida Raza2021-07-01 09:00:012021-07-13 11:28:12Why does a gender-gap persist in vaccination rates?
https://pioneerinstitute.org/wp-content/uploads/Screen-Shot-2021-06-10-at-10.46.32-AM.png
516
920
Maida Raza
https://pioneerinstitute.org/wp-content/uploads/logo_440x96.png
Maida Raza2021-07-01 09:00:012021-07-13 11:28:12Why does a gender-gap persist in vaccination rates? https://pioneerinstitute.org/wp-content/uploads/Untitled-design-2021-06-28T171530.094.png
512
1200
Jamie Gass
https://pioneerinstitute.org/wp-content/uploads/logo_440x96.png
Jamie Gass2021-06-28 16:56:312021-07-13 11:30:49“The Jazz Age” – 1920s America – 50 Resources for High School Students
https://pioneerinstitute.org/wp-content/uploads/Untitled-design-2021-06-28T171530.094.png
512
1200
Jamie Gass
https://pioneerinstitute.org/wp-content/uploads/logo_440x96.png
Jamie Gass2021-06-28 16:56:312021-07-13 11:30:49“The Jazz Age” – 1920s America – 50 Resources for High School Students https://pioneerinstitute.org/wp-content/uploads/Picture1-1.jpg
961
1522
Jamie Gass
https://pioneerinstitute.org/wp-content/uploads/logo_440x96.png
Jamie Gass2021-06-22 20:05:412021-06-23 09:56:14Monarchs of the Sea – American Boats, Ships, & their Captains – 40 Resources for High School Students
https://pioneerinstitute.org/wp-content/uploads/Picture1-1.jpg
961
1522
Jamie Gass
https://pioneerinstitute.org/wp-content/uploads/logo_440x96.png
Jamie Gass2021-06-22 20:05:412021-06-23 09:56:14Monarchs of the Sea – American Boats, Ships, & their Captains – 40 Resources for High School Students https://pioneerinstitute.org/wp-content/uploads/Hubwonk-Template-28.png
512
1024
Editorial Staff
https://pioneerinstitute.org/wp-content/uploads/logo_440x96.png
Editorial Staff2021-06-22 08:11:392021-06-22 08:11:39Alzheimer Breakthrough Disillusionment: Confusion on FDA’s Approval of Expensive and Possibly Ineffective Drug
https://pioneerinstitute.org/wp-content/uploads/Hubwonk-Template-28.png
512
1024
Editorial Staff
https://pioneerinstitute.org/wp-content/uploads/logo_440x96.png
Editorial Staff2021-06-22 08:11:392021-06-22 08:11:39Alzheimer Breakthrough Disillusionment: Confusion on FDA’s Approval of Expensive and Possibly Ineffective Drug https://pioneerinstitute.org/wp-content/uploads/Guest-christina-qi-9.png
1570
3000
Editorial Staff
https://pioneerinstitute.org/wp-content/uploads/logo_440x96.png
Editorial Staff2021-06-17 10:38:572021-06-17 11:49:11Umesh Bhuju Seeks a Fair Deal for Immigrants, Farmers & the Environment
https://pioneerinstitute.org/wp-content/uploads/Guest-christina-qi-9.png
1570
3000
Editorial Staff
https://pioneerinstitute.org/wp-content/uploads/logo_440x96.png
Editorial Staff2021-06-17 10:38:572021-06-17 11:49:11Umesh Bhuju Seeks a Fair Deal for Immigrants, Farmers & the Environment https://pioneerinstitute.org/wp-content/uploads/Copy-of-TLC-template-16.png
512
1024
Editorial Staff
https://pioneerinstitute.org/wp-content/uploads/logo_440x96.png
Editorial Staff2021-06-16 10:29:022023-08-26 10:42:14New York Times Best Seller Paul Reid on Winston Churchill, WWII, & the Cold War
https://pioneerinstitute.org/wp-content/uploads/Screen-Shot-2021-06-10-at-10.46.32-AM.png
516
920
Isabel Wagner
https://pioneerinstitute.org/wp-content/uploads/logo_440x96.png
Isabel Wagner2021-06-14 10:00:412021-06-15 09:50:37Comparing Covid-19 Vaccination and New Infection Rates in Suffolk County: Is Vaccination Working?
https://pioneerinstitute.org/wp-content/uploads/Copy-of-TLC-template-16.png
512
1024
Editorial Staff
https://pioneerinstitute.org/wp-content/uploads/logo_440x96.png
Editorial Staff2021-06-16 10:29:022023-08-26 10:42:14New York Times Best Seller Paul Reid on Winston Churchill, WWII, & the Cold War
https://pioneerinstitute.org/wp-content/uploads/Screen-Shot-2021-06-10-at-10.46.32-AM.png
516
920
Isabel Wagner
https://pioneerinstitute.org/wp-content/uploads/logo_440x96.png
Isabel Wagner2021-06-14 10:00:412021-06-15 09:50:37Comparing Covid-19 Vaccination and New Infection Rates in Suffolk County: Is Vaccination Working? https://pioneerinstitute.org/wp-content/uploads/Education-Resources-2.png
512
1024
Jamie Gass
https://pioneerinstitute.org/wp-content/uploads/logo_440x96.png
Jamie Gass2021-06-14 09:03:472021-06-14 09:09:09The People’s House The U.S. House Representatives – 40 Resources for High School Students
https://pioneerinstitute.org/wp-content/uploads/Education-Resources-2.png
512
1024
Jamie Gass
https://pioneerinstitute.org/wp-content/uploads/logo_440x96.png
Jamie Gass2021-06-14 09:03:472021-06-14 09:09:09The People’s House The U.S. House Representatives – 40 Resources for High School Students
