Comparing Covid-19 Vaccination and New Infection Rates in Suffolk County: Is Vaccination Working?
Massachusetts ranks fourth nationally for the highest percent of population vaccinated, coming behind Vermont, New Hampshire, and Connecticut, with 56.2% of its population fully vaccinated as of May 27. Suffolk County has 68.6% of its residents fully vaccinated and 12.5% partially vaccinated. In theory, the number of new confirmed Covid-19 cases in Suffolk County each day should have fallen with the rise in vaccinations. Is that what actually happened?
Massachusetts has a three-phase vaccination plan that began mid-December 2020. Phase One lasted Dec 2020 – Feb 2021 and prioritized the vaccination of healthcare workers doing direct and COVID-facing care, those in long-term care facilities such as nursing homes or assisted living communities, first responders, and home-based healthcare workers. Phase Two, lasting Feb 2021 – April 19, 2021, started by vaccinating those aged 75+ and those with two certain pre-existing medical conditions, but expanded eligibility later to anyone aged 55 and older and with one pre-existing medical condition. Phase Three, which started April 19, 2021, opened up vaccination eligibility to all aged 16+ who live, work, or study in MA.
Using Pioneer Institute’s Vaccination Tracker, as of May 27, 2021, 68.6% of Suffolk’s population had received at least one dose of a COVID vaccine, and with 99% of eligible MA residents going back for their second shot as of April 20, 2021, it is safe to say that the 12.5% that are only partially vaccinated will be fully vaccinated within weeks. As such, those with at least one vaccine dose will be considered ‘vaccinated’ for the remainder of this post.
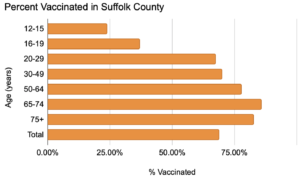
80.5% of Suffolk residents aged 50+, 65.4% of those aged 16-49, and 23.8% of those aged 12-15 have been vaccinated as of May 27.
Overall, as vaccination rates have risen, rates of COVID infection have also fallen in Suffolk. More specifically, the diminishing number of new COVID infections corresponds to the transition into each phase of the MA COVID vaccination plan.

As expected in Winter 2020, the rate of COVID infection spiked, peaking at a 11.1% increase in COVID cases the week of December 6, 2020 compared to the previous week. After that week, the rate of COVID infection did begin to fall dramatically until mid February 2021, averaging a 6.97% increase in new cases for those seven weeks. From FebruaryMapping COVID-19 in Massachusetts Cities & Towns | COVID Tracker until mid-April 2021, the increase in COVID cases levelled off around 1.97%, before starting a steady downward trend in new cases following the week of April 18th. The average percent of new cases since mid-April has been 0.73%.
COVID test positivity rates in MA followed a similar trend according to the HHS Project. On January 1, 2021, the daily positivity rate peaked at 8.6%, but went on to fluctuate around 2.3% from February until mid-April before steadily declining to 0.5% by June 5th. All the while, testing remained consistent, with the US Department of Health and Human Services reporting that between 35k and 110k COVID tests were administered daily between November 2020 and April 2021. Only beginning in May 2021 did the COVID testing rate begin to fall, but hovered around 40k tests performed each day.
Interestingly, the graph depicting Suffolk’s COVID Infection Rate can be divided into three distinct trends that correspond to the beginning of MA’s three vaccination phases, indicated by the highlighted sections of Figure 2.
From Dec 2020 – Feb 2021, the trend is characterized by a sharp increase followed by an equally sharp decrease in infections. Phase One of vaccination also took place during December 2020 – February 2021. However, it is uncertain that vaccination alone was the cause of the decline in the infection rate, as only a relatively small portion of the population was vaccinated during this time. High COVID infection rates during the winter and subsequent lasting immunity caused by persisting antibodies may play a role in the decreasing infection rate.
Between Feb 2021 – mid-April 2021, during which Phase Two was implemented, the COVID infection rate appears to level off, which makes sense considering a large portion of the population was vaccinated during this time. Finally, after April 19, 2021, the COVID infection rate begins to decline steadily at the same time that all people aged 16+ are eligible to be vaccinated.
The negative relationship between increased vaccination and decreased infection rates appears strongly correlated. Overall, as more of the population is vaccinated, COVID infection rates are dropping.
Isabel Wagner is a Roger Perry Government Transparency Intern at the Pioneer Institute. She is currently studying Political Science and Economics at Boston College.

