How Public Transportation’s Efficiency Changed During Covid
The Covid-19 pandemic hit public transportation systems hard, and the MBTA was no exception. As many people opted for either personal transportation or remote work, MBTA ridership, revenue, and efficiency suffered.
However, some systems – such as trains and the ferry – suffered far more than others. For example, while, according to MBTA Analysis, the Commuter Rail only had an operating expense of 59¢ per passenger mile in 2019, it jumped to $1.54 per passenger mile in 2022 – an increase of 161 percent. The operating cost per passenger mile for heavy and light rail increased by similar amounts. In contrast, total operating expenses per passenger mile for buses jumped from $1.67 in 2019 to $3.06 in 2022 – an increase of 83 percent. While a significant loss in cost efficiency, this represents an increase in efficiency between 2021 and 2022.
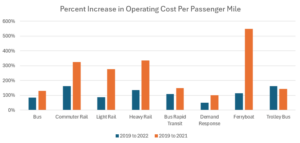
Figure 1: Created from data taken from MBTA Analysis: 2022
The efficiency difference between 2019 and 2022 can be largely attributed to lost ridership. The commuter rail’s total passenger miles dropped 53 percent from 654 million in 2019 to 307 million in 2022. Heavy and light rail systems similarly lost about half their ridership, accounting for a significant portion of operating cost per passenger mile increases across the three services. Buses experienced a 33 percent passenger mile decrease from 258 million to 174 million. This accounts for a significant portion of its 83 percent increase in operating expenses per passenger mile.
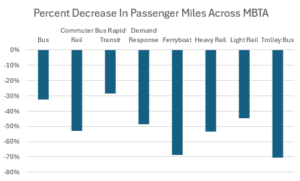
Figure 2: Created from data taken from MBTA Analysis: 2019-2022
Vehicle revenue miles (the miles vehicles travel while in revenue service), however, suffered a far smaller decline than passenger miles. While passenger use of the entire transit system declined steeply from pre-pandemic norms, the T still sought to maintain regular service throughout the day. Vehicle revenue miles for heavy rail dropped only 9.8 percent from 24.6 million in 2019 to 22.2 million in 2022. In comparison, passenger miles for heavy rail dropped 53 percent in the same period. Trolley bus revenue miles dropped the most – 54 percent – but was still below the 70 percent drop it experienced in passenger miles. This trend is seen across the entire MBTA as total vehicle revenue miles dropped 18.1 percent while total passenger miles dropped 49 percent. Directional route miles (total mileage of the routes vehicles cover while in service) across the MBTA, according to MBTA Analysis, only dropped from 2,569 to 2,546.
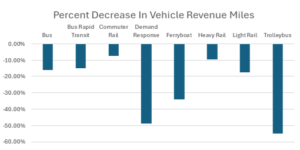
Figure 3: Created from data taken from MBTA Analysis: 2019-2022
Demand response, such as the RIDE, had a greater similarity between its drop in passenger miles and drop in vehicle revenue miles, as vehicle revenue miles fell 48.8 percent while passenger miles dropped 48.4 percent. Compare this to light rail, whose vehicle revenue miles dropped 17 percent while passenger miles dropped 45 percent. The smaller difference for demand response is likely due to the program’s nature as an on-demand service scheduled by riders.
Throughout the pandemic, the MBTA maintained most of its vehicle fleet. According to MBTA Analysis, total vehicles operated in maximum service only dropped from 2,464 to 2,018. This helped maintain vehicle revenue miles even as passenger miles dropped. It was likely a necessity, as a large number of vehicles are required to maintain regular service times. However, revenue has failed to recover to pre-pandemic levels, as the MBTA’s 2023 financial statement puts transportation revenue at $376 million, far from the $671 million collected in 2019. Such shortfalls will only exacerbate the transportation agency’s pre-existing money problems.
About the Author: Raif Boit is a Roger Perry Transparency Intern at Pioneer Institute for the summer of 2024. He is a rising freshman at Harvard College.

