What if “The Ride” operated like the best big paratransit systems in the US?
OK, let’s cut straight to the answer. If The Ride had operated as cost-efficiently as the ten most cost-efficient large-scale paratransit systems in FY2013, it would have saved between $48.2 million and $60.3 million in FY2013.
If the MBTA can bring its costs per passenger trip going forward to the level of the average of the ten most cost efficient large scale paratransit systems in other U.S. cities, it will generate savings of $373 million between FY2016 and FY2021, the end of its current paratransit provider contract.
Here’s the analysis to back up those claims.
Pioneer Institute published a report yesterday concerning The Ride, the MBTA’s demand response paratransit service, comparing its cost per trip to that of other Massachusetts demand response paratransit systems including the EOHHS Human Services Transportation Office and the 13 Regional Transit Systems. The following data compares The Ride’s performance with that of the 20 public paratransit systems across the United States that provided the greatest number of passenger trips in FY2013, the most recent year for which data is available from the National Transit Database, the federal repository of transit data.
The MassDOT Board of Directors approved three seven-year contracts totaling $916,911,999 for paratransit service. Yesterday’s report explains that the T has the right to cancel those contracts without cause upon 30-days written notice.
Analysis
Figure 1 shows the operating expense per passenger trip for each of the 20 largest paratransit systems in the U.S., i.e. those that provided the most paratransit passenger trips in FY2013. The Ride had an average cost per passenger trip of $49.60, which is virtually equal to that of the average of the 10 worst performing agencies. The 10 best performing transit systems had an average cost per trip of $26.73. At $49.60 per passenger trip, The Ride was 85.6% more expensive than the ten best performing agencies in the U.S.
FIGURE 1. Operating Expenses per Passenger Trip, $
| System Name | Cost/Passenger Trip |
| New York NY (NYCT) | $71.89 |
| Newark NJ (NJ Transit) | $62.97 |
| Dover DE (DTC) | $53.30 |
| Seattle WA (King County Metro) | $52.72 |
| Washington DC (WMATA) | $50.77 |
| AVERAGE WORST 10 | $49.60 |
| MBTA | $49.60 |
| Baltimore MD (MTA) | $44.84 |
| AVERAGE TOP 20 | $38.16 |
| Denver CO (RTD) | $38.15 |
| Arlington Heights IL (ADA PACE) | $37.46 |
| Portland OR (TriMet) | $34.29 |
| El Monte CA (Access Services) | $33.41 |
| Orange County CA (OCTA) | $33.09 |
| San Antonio TX (VIA) | $30.59 |
| Philadelphia PA (SEPTA) | $30.22 |
| St. Paul MN (Metro Mobility) | $27.04 |
| Miami FL (MDT) | $26.80 |
| AVERAGE BEST 10 | $26.73 |
| Houston TX (Metro) | $26.40 |
| Pittsburgh PA (Port Authority) | $21.13 |
| Pace – Suburban Bus Division(PACE) | $20.10 |
| LACMTA – Small Operators(LACMTA) | $18.50 |
Figure 2 is a graphical presentation of the data presented above, the operating expense per passenger trip for each of the 20 largest paratransit systems in the U.S., i.e., those that provided the most paratransit passenger trips in FY2013.
FIGURE 2. Graph of Operating Expenses per Passenger Trip
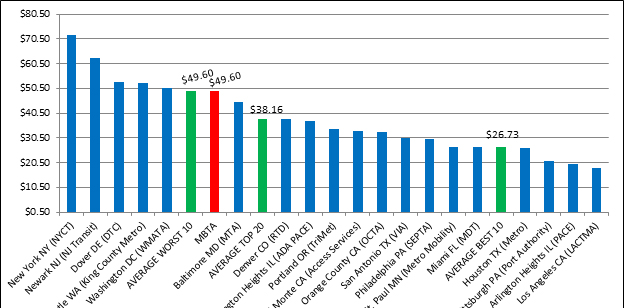
Figure 3 demonstrates how much in savings The RIDE would have generated had its costs per passenger trip in FY2013 been equal to that of the ten most cost efficient paratransit systems (of the 20 largest U.S. paratransit systems.) The average cost per trip of the ten best-performing paratransit systems in FY2013 was $26.73 per trip. The Ride’s average cost per trip was $49.60, 85.6% higher. In FY2013, The Ride provided 2,108,870 total passenger trips. Had The RIDE’s trips been provided a cost of $26.73 per trip, it would have saved $48,227,810 in FY2013.
FIGURE 3. Savings if The Ride’s costs passenger trip were equal to those of efficient paratransit systems, $
| Cost/trip | The RIDE trips FY2013 | Total | |
| MBTA cost/trip | $49.60 | 2,108,870 | $104,594,318 |
| 10 best transit systems cost per trip | $26.73 | 2,108,870 | $56,366,508 |
| The RIDE excess cost | 85.6% | $48,227,810 |
Figure 4 shows the operating expense per passenger mile travelled for each of the 20 largest paratransit systems in the U.S., i.e., those that provided the most paratransit passenger trips in FY2013. The Ride had an average cost per passenger mile of $6.93, which was 54.4% higher than the average of the top 20 U.S. paratransit systems ($6.93 vs $4.49). It was third highest of the 20 largest systems and worse than the average ($6.04) of the ten worst performing systems. The 10 best performing transit systems had an average cost per passenger mile of $2.94. At $49.60 per passenger trip, the RIDE was 85.6% more expensive than the ten best performing agencies in the U.S. in FY2013.
FIGURE 4. Operating Expenses per Passenger Mile, $
| System Name | Cost per Passenger Mile |
| Newark NJ (NJ Transit) | $9.87 |
| New York NY (NYCT) | $8.56 |
| MBTA | $6.93 |
| Washington DC (WMATA) | $6.38 |
| AVERAGE WORST 10 | $6.04 |
| Baltimore MD (MTA) | $5.48 |
| Los Angeles CA (LACTMA) | $5.32 |
| Seattle WA (King County Metro) | $4.97 |
| AVERAGE TOP 20 | $4.49 |
| Denver CO (RTD) | $4.40 |
| Dover DE (DTC) | $4.28 |
| Arlington Heights IL (ADA PACE) | $4.20 |
| Philadelphia PA (SEPTA) | $4.07 |
| Arlington Heights IL (PACE) | $3.47 |
| Portland OR (TriMet) | $3.46 |
| Orange County CA (OCTA) | $3.21 |
| AVERAGE BEST 10 | $2.94 |
| San Antonio TX (VIA) | $2.74 |
| Pittsburgh PA (Port Authority) | $2.73 |
| St. Paul MN (Metro Mobility) | $2.64 |
| El Monte CA (Access Services) | $2.56 |
| Houston TX (Metro) | $2.40 |
| Miami FL (MDT) | $2.10 |
Figure 5 is a graphical presentation of the data presented above, the operating expense per passenger mile for each of the 20 largest paratransit systems in the U.S., i.e., those that provided the most paratransit passenger trips in FY2013.
FIGURE 5. Operating Expenses per Passenger Mile (Graphic)
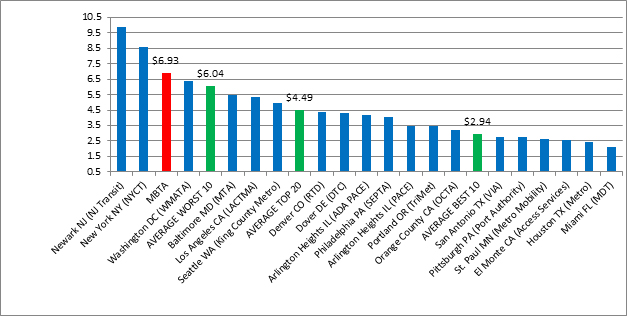
Figure 6 demonstrates how much in savings The Ride would have generated had its costs per passenger mile in FY2013 been equal to that of the ten most cost efficient paratransit systems (of the 20 largest U.S. paratransit systems based upon total passenger trips provided.) The average cost per passenger mile of the ten best-performing paratransit systems in FY2013 was $2.94 per mile. The Ride’s average cost per passenger mile was $6.93, 135.92% higher. In FY2013, The Ride provided 15,087,595 total passenger miles of service. Had The Ride’s trips been provided a cost of $26.73 per passenger mile, it would have saved $60,259,954 in FY2013.
FIGURE 6. Savings if The Ride’s costs per passenger mile were equal to those of efficient paratransit systems, 2013, $
| Cost/passenger mile | The Ride passenger miles | Total | |
| MBTA cost/passenger mile | $6.93 | 15,087,595 | $104,594,318 |
| 10 best transit systems cost/passenger mile | $2.94 | 15,087,595 | $44,334,364 |
| The RIDE excess cost | 135.92% | $60,259,954 |
Figure 7 shows how many passenger trips were provided per vehicle revenue mile for each of the 20 largest paratransit systems in the U.S., i.e. those that provided the most paratransit passenger trips in FY2013. Revenue hours are the hours that vehicles are scheduled to or actually travel while in revenue service. Passenger trips per revenue hour are commonly cited as an efficiency measure for paratransit systems. A higher number of passenger trips per revenue hour are more efficient than a lower number. The Ride had the second lowest number of passenger trips per revenue hour of the 20 largest paratransit systems in FY2013 at 1.5 trips per revenue hour. The average of the 20 largest systems was 2.0 trips per revenue hour. The ten best performing systems by this efficiency measure delivered an average of 2.5 trips per revenue hour versus 1.5 trips delivered by The Ride; i.e., the ten best-performing systems on average delivered 66.7% (two-thirds) more trips per passenger hour than did The Ride.
FIGURE 7. Passenger Trips per Revenue Hour
| System Name | Passenger trips per revenue hour |
| Los Angeles CA (LACTMA) | 4.0 |
| Arlington Heights IL (PACE) | 3.5 |
| Pittsburgh PA (Port Authority) | 2.6 |
| AVERAGE BEST 10 | 2.5 |
| Orange County CA (OCTA) | 2.4 |
| San Antonio TX (VIA) | 2.2 |
| Dover DE (DTC) | 2.1 |
| Portland OR (TriMet) | 2.1 |
| St. Paul MN (Metro Mobility) | 2.1 |
| AVERAGE TOP 20 | 2.0 |
| Denver CO (RTD) | 1.8 |
| Arlington Heights IL (ADA PACE) | 1.8 |
| El Monte CA (Access Services) | 1.8 |
| Houston TX (Metro) | 1.8 |
| Philadelphia PA (SEPTA) | 1.7 |
| Seattle WA (King County Metro) | 1.7 |
| Newark NJ (NJ Transit) | 1.7 |
| Baltimore MD (MTA) | 1.7 |
| AVERAGE WORST 10 | 1.6 |
| Miami FL (MDT) | 1.6 |
| New York NY (NYCT) | 1.6 |
| MBTA | 1.5 |
| Washington DC (WMATA) | 1.1 |
Figure 8 is a graphical presentation of the data presented above, passenger trips per vehicle revenue hour for each of the 20 largest paratransit systems in the U.S., i.e., those that provided the most paratransit passenger trips in FY2013.
FIGURE 8. Passenger Trips per Vehicle Revenue Hour (Graph)

Figure 9 shows the number of passenger trips per vehicle revenue mile for each of the 20 largest paratransit systems in the U.S., i.e. those that provided the most paratransit passenger trips in FY2013. Vehicle revenue miles are the miles that vehicles travel while in revenue service. This efficiency measure indicates how many passengers on average are on board paratransit vehicles per mile travelled. An important goal of paratransit systems is to plan routes and dispatching strategies to maximize shared rides when it is possible to do so, thereby reducing costs. Data submitted by The Ride to the National Transit Database indicates that it had on average of 0.89 passengers on board its vehicles per vehicle revenue mile in FY2013. This is the third worst of the twenty largest paratransit systems. The average of the twenty largest systems was .36 passengers per mile travelled. The average number of passengers per vehicle revenue mile among the ten best-performing paratransit systems by this measure was 1.36, which is 53.4% more that The Ride (i.e., 1.36/0.89 = 153.4%).
FIGURE 9. Passenger Trips per Vehicle Revenue Mile
| System Name | Passenger Trips per Vehicle Revenue Mile |
| Orange County CA (OCTA) | 1.51 |
| Miami FL (MDT) | 1.48 |
| Dover DE (DTC) | 1.42 |
| Portland OR (TriMet) | 1.38 |
| El Monte CA (Access Services) | 1.38 |
| AVERAGE TOP 10 – MILES/TRIP | 1.36 |
| Pittsburgh PA (Port Authority) | 1.33 |
| Arlington Heights IL (PACE) | 1.32 |
| San Antonio TX (VIA) | 1.32 |
| Los Angeles CA (LACTMA) | 1.23 |
| Seattle WA (King County Metro) | 1.22 |
| St. Paul MN (Metro Mobility) | 1.20 |
| AVERAGE TOP 20 – MILES/TRIP | 1.19 |
| Houston TX (Metro) | 1.16 |
| Philadelphia PA (SEPTA) | 1.16 |
| Baltimore MD (MTA) | 1.09 |
| New York NY (NYCT) | 1.09 |
| Arlington Heights IL (ADA PACE) | 1.08 |
| Denver CO (RTD) | 1.06 |
| AVERAGE BOTTOM 10 – MILES/TRIP | 1.02 |
| MBTA | 0.89 |
| Washington DC (WMATA) | 0.86 |
| Newark NJ (NJ Transit) | 0.61 |
Figure 10 is a graphical presentation of the data presented above, passengers per revenue mile for each of the 20 largest paratransit systems in the U.S., i.e., those that provided the most paratransit passenger trips in FY2013.
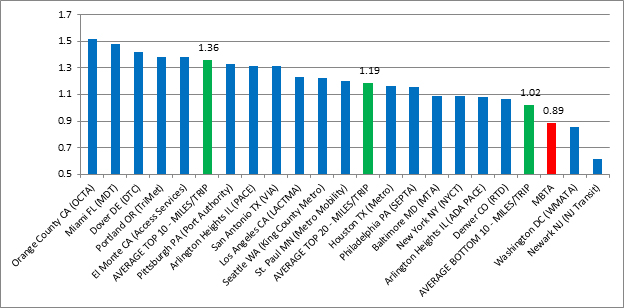
Figure 11 calculates how much savings The Ride would generate between FY2016 and FY2021 if it reduced its cost per passenger trip by 46.1% to the average cost per trip of the ten most cost-efficient paratransit systems. As described above, the ten most cost-efficient paratransit systems (of the twenty largest systems in the U.S.) had an average cost per trip of $26.73 in FY2013, which is 46.1% less than The Ride’s cost per trip of $49.60 in FY2013, the most recent year for which federal data is available. The annual budget amounts and estimated passenger trips in Figure 11 come from The MBTA’s 2013 RFP for paratransit provider services. The results demonstrate that if The Ride reduced its costs per passenger trip as described, it would generate savings of $373,867,417 between FY2016 and FY2021, the end of the current paratransit provider contract.
FIGURE 11. Savings if The Ride’s cost per passenger trip equaled the average of 10 most cost-efficient paratransit systems, 2016-2021, $
| The Ride | ||||||
| Budget Year | Budget (per contract) |
Passenger trips (estimated per RFP) |
Cost per trip (per RFP) | 10 system cost per trip (average) | The Ride cost if = 10 Best Systems | Savings to the MBTA |
| FY16 | $110,936,812 | 2,099,058 | $52.85 | $28.48 | $59,784,517 | $51,152,295 |
| FY17 | $119,371,356 | 2,219,858 | $53.77 | $28.98 | $64,329,943 | $55,041,413 |
| FY18 | $128,627,018 | 2,350,951 | $54.71 | $29.49 | $69,317,875 | $59,309,143 |
| FY19 | $138,176,590 | 2,482,044 | $55.67 | $30.00 | $74,464,197 | $63,712,393 |
| FY20 | $150,402,879 | 2,613,137 | $57.56 | $31.02 | $81,053,018 | $69,349,861 |
| FY21 | $163,312,289 | 2,744,231 | $59.51 | $32.07 | $88,009,977 | $75,302,312 |
| TOTAL | $810,826,945 | 14,509,279 | $436,959,527 | $373,867,417 | ||
Conclusion
The data presented above indicates four important things:
- If The Ride reduces its costs per passenger trip by 46.1% to the level of the average of the ten most-cost efficient large-scale paratransit systems (among the 20 largest paratransit systems in the U.S.), it would generate savings of $373,867,417 between FY2016 and FY2021, the end of the current paratransit provider contract.
- If The Ride had operated at the same cost-efficiency level per passenger trip as the ten best performing big paratransit systems in FY2013, it would have saved $48,227,810.
- If The Ride operated at the same cost-efficiency level per passenger mile as the ten best performing big paratransit systems in FY2013, it would have saved $60,259,954.
- The Ride had the second worst record among the biggest paratransit systems in the U.S. in passenger trips per hour, a key cost-efficiency measure, in FY2013.
- The Ride had the third worst record among the biggest paratransit systems in the U.S. in passenger trips per revenue mile, a et cost-efficiency measure, in FY2013.

