Welcome News from the New Team at the MBTA: Getting Serious About Savings
The Boston Globe reports today that MBTA officials briefed MBTA union officials last week about their forthcoming plan to request information from outside companies on running about 30 of the T’s 170 current bus routes, representing approximately 17 percent of its total routes.
This should be welcomed news to state taxpayers and local property taxpayers in the cities and towns of the MBTA district.
MBTA employees unions have held a virtual monopoly on T bus operations and bus maintenance services since passage of legislation adopted in 1993 that effectively handcuffed T management from outsourcing these and other services. The protectionist Pacheco Law was adopted five months after then-Governor William Weld proposed privatizing some of the MBTA’s bus operations and maintenance services. The law undid a legislative reform adopted in 1980 that had allowed MBTA management the option of entering into contracts with private companies to provide service, including bus service and bus maintenance.
Last month, the legislature restored to T management the right to competitively procure these services on a three-year trial basis by suspending the Pacheco Law at the MBTA and allowing contracts entered into during that period to be exempt from the law going forward.
It may surprise observers of the MBTA that prior to 1997 the MBTA had been outsourcing approximately the same percentage of bus service that is now being proposed by the MBTA. The MBTA’s contemplated competitive procurement of 30 bus routes out of the T’s total of 170 routes represents approximately 17 percent of its total routes. During 1997, the year of a Pacheco ruling that disallowed two proposed outsourcing contracts, the MBTA continued to provide purchased bus service under pre-existing contracts with private companies. The MBTA paid contractors in 1997 for a total of 4.65 million revenue miles of bus service (17 percent of the MBTA’s total), which ranked the T as the seventh largest purchaser of privately contracted bus service in the U.S. that year. In 1997 the MBTA paid vendors to operate 65 large buses and 25 smaller ones. The MBTA’s cost for contracted bus service in 1997, as reported on the National Transit Database, was the lowest of any U.S. bus transit agency that provided more than a million miles of contracted bus service in that year.
Pioneer Institute issued a report six weeks ago to legislative leaders and the Baker administration during deliberations about suspending Pacheco Law. The report shed light on opportunities for savings at the MBTA through the outsourcing of bus operations and maintenance services, including the following:
- A report published by the National Center for Transit Research sponsored in part by the U.S. Department of Transportation entitled “Analysis of Contracting for Fixed Route Bus Service” found that in the nation’s large transit systems, defined as those with 250 or more vehicles operating at maximum service, agencies paid 40.4 percent less in 2008 by contracting for fixed-route bus services per revenue mile ($6.67 per mile) than for directly provided bus transportation ($11.19 per mile).
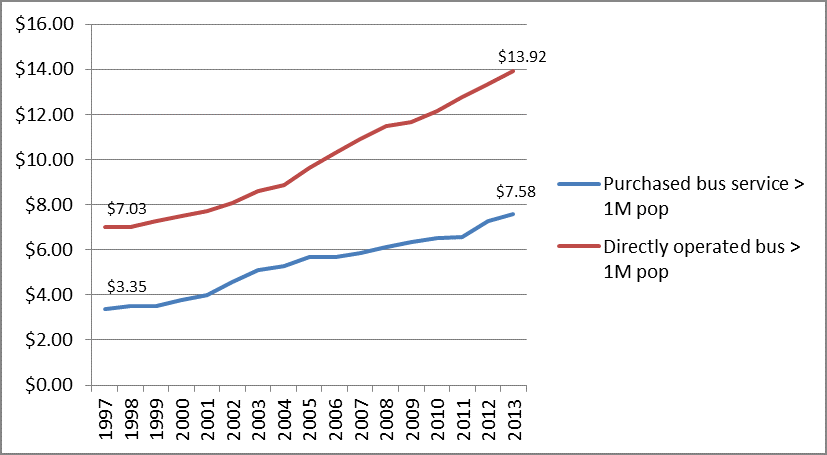
- In 2013, the average cost for purchased bus service among U.S. transit agencies serving populations greater than one million was $7.58 per revenue mile, 41.3 percent less than the $12.92 cost of directly- provided bus service.
- In 2013, the nation’s largest providers of hybrid bus service, i.e., those that both purchase and provide bus service directly, paid an average of $11.41 per mile for their directly provided service versus $6.38 per mile for purchased service, an average savings of 44.1 percent per mile.
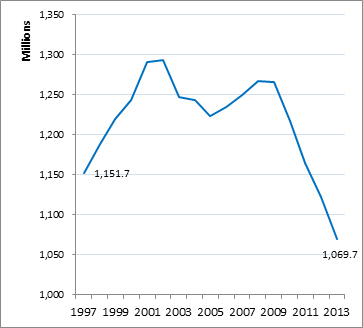
- In the years since the 1997 Pacheco decision, transit agencies across the country have increased their purchasing of contracted bus service dramatically. Transit agencies serving areas with populations greater than one million increased their annual purchase of private bus service from 93.9 million miles in 1997 to 221.8 million in 2013, an increase of 127.8 million miles. During the same period, directly provided service by these agencies declined by 82.0 million miles. The reason for this wholesale substitution is easy to understand: from 1997 to 2013 purchased transportation cost 42.2 percent less per mile than directly provided service at these transit agencies.
As demonstrated in the following chart, outsourced bus service has consistently cost far less than agency-provided service.
Figure 1. Comparison of expense per revenue mile of purchased bus services with directly operated bus service by major U.S. transit agencies serving populations of greater than 1 million, 1997-2013
Recommendation to T management regarding procurement of bus service: Include bus maintenance services in the procurement.
In order to effectuate potential savings from the privatization of MBTA bus service, T management should include in its procurement not only the actual operation of buses but also the maintenance of buses used on the outsourced routes. Pioneer’s report showed that the principal reason for the MBTA’s high cost of directly provided bus service is its high bus maintenance cost. Of 425 bus transit agencies in the US in 2013, the MBTA had the highest bus maintenance cost per vehicle revenue hour (VRH) of bus operation. The MBTA’s high bus maintenance cost is attributable in large part to its high maintenance staffing and labor hours per vehicle mile: the MBTA has 59.6 percent more full-time bus maintenance personnel per bus mile than the average of the five peer bus transit agencies as designated by the Federal Transit Administration (FTA) and incorporated in the FTA-sponsored Integrated National Transit Database Analysis System (INTDAS). Its maintenance costs per bus mile are 92.2 percent higher than its five peer agencies. Its labor hours per vehicle mile are 65.7 percent higher than average of its peer agencies.
Figure 2 shows that the MBTA had the highest maintenance cost per vehicle revenue mile (VRM) of the five peer agencies in 2013 at $4.57, 92.2 percent higher than the $2.38 average of the five peer agencies. Had the MBTA reduced its total bus maintenance expenses per revenue mile in 2013 to the average level of its five INTDAS peers, it would have saved $49.8 million dollars in 2013. Over the 10-year period from 2004 and 2013, the MBTA incurred bus maintenance costs per mile of $3.39, 44.8 percent higher than that of its five peer bus agencies. Had the MBTA operated at the average maintenance cost per revenue mile of its peer agencies over that period, it would have saved more than $250 million dollars.
Figure 2. Vehicle maintenance cost per revenue mile, MBTA compared to INTDAS peers, 2013 and 2004-2013
| Transit Agency | Maintenance /VRM 2013 | Maintenance/VRM 2004-2013 |
| Boston (MBTA) | $4.57 | $3.39 |
| Philadelphia (SEPTA) | $2.55 | $2.14 |
| Washington, D.C. (WMATA) | $2.99 | $3.14 |
| Baltimore (MTA) | $2.13 | $2.72 |
| Atlanta (MARTA) | $2.03 | $1.74 |
| Miami (MDT) | $2.18 | $1.99 |
| AVERAGE 5 PEERS | $2.38 | $2.34 |
| MBTA above peer average/VRM | $2.19 | $1.05 |
| MBTA % above peer average/VRM | 92.2% | 44.8% |
| MBTA VRM | 22,719,357 | 240,272,542 |
| MBTA savings if at peer average | $49,777,067 | $252,235,474 |
One reason for the MBTA’s extraordinarily high bus maintenance costs is its high number of annual bus maintenance work hours compared to those of its INTDAS peer bus agencies. Figure 3 shows that the MBTA had the greatest number of maintenance work hours per vehicle revenue mile of the INTDAS peer agencies in 2013 at 57.2 maintenance work hours per 1,000 vehicle revenue miles, 65.7 percent higher than the 34.5 hour average of its peer agencies. Had the MBTA reduced its total bus maintenance work hours per vehicle revenue mile in 2013 to the average of its five INTDAS peers, it would have reduced its total work hours by more than 500,000 hours. Looking back five years earlier, we see that the same phenomenon occurred in 2009, with the MBTA incurring 49.7 percent more work hours per revenue mile than its peer agencies. In that year the MBTA paid its bus maintenance employees to provide 50.3 hours of maintenance work per 1,000 revenue miles compared to the average of its peers, 35.9 hours.
As shown in Pioneer’s recent report, the average MBTA bus was 15 days older than the average of its INTDAS peers in 2009 and 43 weeks older than its peers in 2013. The same disproportionately high number of work hours per vehicle hour occurred five years earlier in 2009, when the MBTA paid for 60.6 bus maintenance work hours per 100 revenue hours of bus operations while its peer agencies needed an average of only 40.5 hours, 49.7 percent fewer. Had the MBTA reduced its total bus maintenance work hours per vehicle revenue hour in 2009 to the average of its five INTDAS peers, it would have reduced its total work hours by more than 450,000.
Figure 3. Bus maintenance work hours per revenue mile and revenue hour, MBTA compared to INTDAS peers, 2009 and 2013
| Transit Agency | Work hours/1K VRM 2013 | Work hours/1K VRM 2009 | Work hours/100 VRH 2009 | Work hours/100 VRH 2013 |
| Boston (MBTA) | 57.2 | 50.3 | 52.59 | 60.61 |
| Philadelphia (SEPTA) | 38.0 | 39.1 | 40.19 | 39.33 |
| Washington, D.C. (WMATA) | 43.4 | 36.9 | 39.98 | 45.03 |
| Baltimore (MTA) | 37.2 | 41.5 | 47.83 | 41.01 |
| Atlanta (MARTA) | 29.5 | 29.6 | 36.90 | 42.94 |
| Miami (MDT) | 24.4 | 32.5 | 39.01 | 34.06 |
| AVERAGE 5 PEERS | 34.5 | 35.9 | 40.8 | 40.5 |
| MBTA above average of peers | 65.7% | 40.1% | 29.0% | 49.7% |
| MBTA VRM, VRH | 24,194,260 | 23,824,480 | 2,279,516 | 2,283,137 |
| MBTA work hours | 1,383,740 | 1,198,769 | 1,198,769 | 1,383,740 |
| MBTA hours in excess of peer average hours per VRM and VRH | 548,544 | 343,374 | 269,139 | 459,612 |
Another reason for the MBTA’s high bus maintenance costs is the high staffing level of its bus maintenance division compared with that of its INTDAS peer bus agencies. Figure 4 demonstrates that the MBTA had the greatest number of full-time maintenance employees per vehicle revenue mile of the INTDAS peer group in 2013. The MBTA’s staffing rate of 2.9 employees per 100,000 vehicle revenue miles was 59.6 percent more than the 1.8 employee average of its peer agencies. The inverse way to express this statistic is to say that the average peer agency had 37.3 percent fewer employees per revenue mile in 2013 than the MBTA had. Considering that the MBTA employs 710 full-time employees in its bus division, that adds up to a big number. The next closest agency with respect to staffing per vehicle mile in the peer group was Washington, D.C.’s WMATA bus transit system, which employed 2.3 maintenance employees per revenue mile, 20 percent less per revenue mile and 22 percent less per revenue hour than the MBTA. In order to match the staffing level of WMATA, the MBTA would have needed to reduce its full time bus maintenance staffing by more than 140 employees.
Looking back five years, we see that the same phenomenon was already occurring then. In 2009, the MBTA employed 49.4 percent more employees per revenue mile than its peer agencies did. High MBTA staffing levels are evidenced by a comparison of maintenance employees per bus revenue hour, with the MBTA exceeding the average of its peer agencies by 44.9 percent and 37.7 percent in 2013 and 2009 respectively.
Figure 4. Bus maintenance employee count per revenue mile and revenue hour, MBTA compared to INTDAS peers, 2009 and 2013
| Transit Agency | Employee count/100K VRM 2013 | Employee count/100K VRM 2009 | Employee count/10K VRH 2013 | Employee count/100K VRH 2009 |
| Boston (MBTA) | 2.9 | 2.8 | 3.1 | 2.9 |
| Philadelphia (SEPTA) | 2.1 | 2.0 | 2.2 | 2.1 |
| Washington, D.C. (WMATA) | 2.3 | 2.1 | 2.4 | 2.3 |
| Baltimore (MTA) | 2.0 | 2.0 | 2.2 | 2.3 |
| Atlanta (MARTA) | 1.4 | 1.5 | 2.1 | 1.9 |
| Miami (MDT) | 1.3 | 1.7 | 1.9 | 2.0 |
| AVERAGE 5 PEERS | 1.8 | 1.9 | 2.1 | 2.1 |
| MBTA above average of peers | 59.6% | 49.4% | 44.9% | 37.7% |
| MBTA VRM, VRH | 24,194,260 | 23,824,480 | 2,283,137 | 2,279,516 |
| MBTA full time employee count | 710 | 665 | 710 | 665 |
| MBTA FTEs in excess of peer average | 265.1 | 219.9 | 219.8 | 182.1 |
By allowing the MBTA to solicit competitive bids for bus operations and maintenance services, the legislature and governor have taken a reasonable step completely in line with national trends.
A November 2013 report by the National Center for Transit Research entitled “Transit Contracting Models and Proper Incentives for Long Term Success” concluded that “contracting with private service providers for the management, operation and maintenance of transit services has become an acceptable business practice within the transit industry.” It also concluded, “The most common reason that transit agencies contracted service was to improve operational cost efficiency, followed by the desire to take advantage of resources available to private contractors that would enhance the agency’s capability to start new service or expand existing service.”
Since 1997, Massachusetts has gone in the opposite direction of other U.S. transit agencies with respect to contracting for bus service. According to data from the NTD (presented in figures 5 and 6), U.S. transit agencies serving population areas of one million or more increased their total amount of purchased bus service from 93.9 million revenue miles in 1997 to 221.8 million in 2013—an increase of 127.9 million (136.2 percent.) Over the same period, the total amount of directly operated bus service at these larger transit agencies has decreased from 1.15 billion revenue miles to 1.07 billion miles, a drop of 82.0 million, meaning that agencies have been substituting purchased service for agency-provided service to a considerable extent.
Figure 5. Total Purchased Bus Service, by revenue mile, US transit agencies serving populations > 1 million, 1997-2013
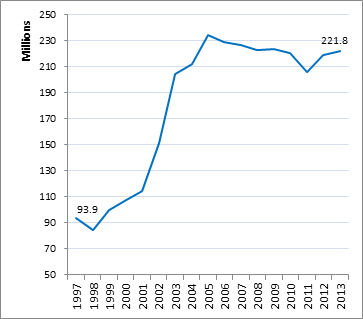
Figure 6. Total direct service, by revenue mile, US transit agencies serving populations > 1 million, 1997-2013
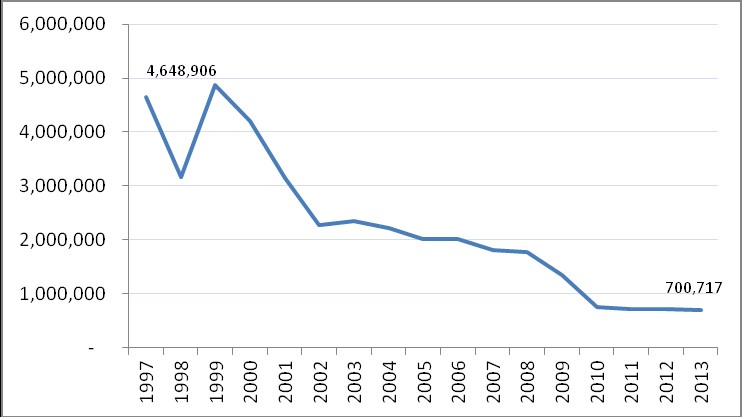
As figure 7 shows, from 1997 to 2013, as a result of the Pacheco ruling, the MBTA reduced its purchased bus service from 4.6 million to 0.7 million revenue miles per year, a decrease of 84.9 percent.
Figure 7. Total Purchased Bus Service, by revenue mile, MBTA, 1997-2013
The legislature was wise to allow the MBTA administration to identify opportunities for savings through competitive procurement of bus service, a practice employed by public transit agencies across the United States. In order to take full advantage of this opportunity, MBTA administrators should include maintenance of buses as part of its procurement.

