The MBTA’s Problem is Not Lack of Funding
Background
Since the mid-1990s, Pioneer has participated in the public debate concerning ways to improve the operations and financial footing of the MBTA through reports, events, public testimony and participation on a state-appointed commission. Our principal interests have been the Authority’s operations, finances, pension system and governance (leadership and accountability) model. With the crisis this winter, the Institute has redoubled its efforts to provide insights on these topics. As part of that work, we have examined various aspects of the MBTA’s funding picture, especially as many have responded to the crisis by simply calling for more funding from the state.
Even as the Institute has called for debt relief for the MBTA, we believe it is important to underscore the level of funding it currently receives from state and local, federal, fare and other sources. Certainly, questions of finance are also related to decisions around expansion, as we underscored in our March 12 report, Setting the Record Straight on MBTA Expansion, which demonstrated that the MBTA has added more commuter rail miles from 1991 to 2013 than any other commuter rail system operating in the nation at that time. But a much closer review of the funding sources of the MBTA is needed to craft policy proposals that will improve the Authority’s operations.
Our March 16th report, The Myth of the Underfunded MBTA, noted that, as measured by both passenger miles traveled and vehicle revenue hours, the T received the most capital funding of any of the nation’s 10 largest transit agencies between 1991 and 2013, the most recent year for which data are available. This report, The MBTA’s Problem is Not Lack of Funding, seeks to clarify and verify our initial analyses in The Myth of the Underfunded MBTA, but also to expand that examination from capital to include operating funds. In doing so, this study employs the Federal Transit Administration’s own peer group for the MBTA so as to ensure comparability. Specifically, The MBTA’s Problem is Not Lack of Funding examines the level of local, state and federal funds — capital, operating, and then “all funds” (capital and operating) — received by the Authority in comparison to other transit systems in the country.
Using INTDAS’ peer-group methodology
This report presents a comparison of the MBTA’s capital and operating funding from 1991 to 2013 with that of five peer transit agencies identified as peers by the Integrated National Transit Database Analysis System (INTDAS). INTDAS is a web database system designed for retrieval and analysis of data from the National Transit Database (NTD) and is partially funded by the Federal Transit Administration in cooperation with and under the direction and leadership of the Florida Department of Transportation’s Transit Information System. As one of its many useful functions, INTDAS includes an online automated transit agency peer selection process that identifies comparable transit systems for peer analyses.
The peer-grouping methodology can be applied to a transit agency as a whole (considering all modes operated by that agency), or to any of the specific modes an agency operates. This report looks at system-wide peer agencies. Following this report, Pioneer Institute intends to present an analysis comparing the MBTA to peer transit agencies by transit mode; i.e., commuter rail, hard rail subway, light rail trolley, electric trolley bus, bus, and direct response (The Ride).
The peer transit agencies utilized in this report represent all five transit systems identified by INTDAS as having “likeness scores” good enough not to be deemed “undesirable due to a large number of differences with the target agency.” Likeness scores are used to determine the level of similarity between a potential peer agency and the target agency both with respect to individual factors (e.g., urban area population, modes operated, and service areas) and for the agencies overall.
According to INTDAS:
[A] total likeness score of 0 indicates a perfect match between two agencies (and is unlikely to ever occur). Higher scores indicate greater levels of dissimilarity between two agencies. In general, a total likeness score under 0.50 indicates a good match, a score between 0.50 and 0.74 represents a satisfactory match, and a score between 0.75 and 0.99 represents potential peers that may usable, but care should be taken to investigate potential differences that may make them unsuitable. Peers with scores greater than or equal to 1.00 are undesirable due to a large number of differences with the target agency, but may occasionally be the only candidates available to fill out a peer group.
As shown in figure 1, the five transit systems used in this analysis received the following transit peer likeness scores — using the MBTA as the target agency — from the automated INTDAS system.
Figure 1. Transit Agencies and INTDAS Peer Likeness Scores
| Transit Agency | City | State | INTDAS Score |
|---|---|---|---|
| Massachusetts Bay Transportation Authority | Boston | MA | 0 |
| Maryland Transit Administration | Baltimore | MD | 0.57 |
| Southeastern Pennsylvania Transportation Authority | Philadelphia | PA | 0.65 |
| Washington Metropolitan Area Transit Authority | Washington | DC | 0.76 |
| Los Angeles County Metropolitan Transportation Authority | Los Angeles | CA | 0.96 |
| Chicago Transit Authority | Chicago | IL | 0.98 |
All other transit systems received likeness scores higher than 1.0 and were therefore deemed undesirable due to a large number of differences with the MBTA.
Using these peer agencies, this report examines MBTA funding, both capital and operating, from 1991 to 2013, all years including the most recent year for which data is available online from the National Transit Database.
This report analyzes the capital and operating funding of the MBTA and the five peer group transit agencies using two measures described as “transit investment measures” in Transit Cooperative Research Program (TCRP) Report 141, “A Methodology for Performance Measurement and Peer Comparison in the Public Transportation Industry” sponsored by the Federal Transit Administration. The two measures are “operating funding per capita” and “capital funding per capita.” The TCRP report explains: “Transit investment measures look at local, state, and federal investments in transit service and infrastructure and the agency’s investment in transit vehicles. These measures can also compare the total transit investment to the number of people within an agency service area or region.”
Findings
Capital Funds
In figure 2 we present capital funding received by the subject transit agencies from local, state and federal sources between 1991 and 2013.
Figure 2: Capital Funding, Total, Federal Share and State/Local Share, 1991-2013
| Transit Agency | Total Funds | Federal Funds | State/Local Funds |
|---|---|---|---|
| MBTA | $9,848,831,126 | $3,778,202,533 | $6,070,628,593 |
| SEPTA | $7,280,347,134 | $3,973,638,917 | $3,306,708,217 |
| CTA | $8,877,437,859 | $4,467,839,970 | $4,409,597,889 |
| WMATA | $9,705,512,322 | $6,341,195,438 | $3,364,316,884 |
| LACMTA | $7,252,285,033 | $2,720,869,337 | $4,531,415,696 |
| MTA | $4,166,618,081 | $2,361,857,699 | $1,804,760,382 |
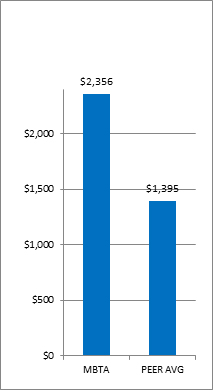
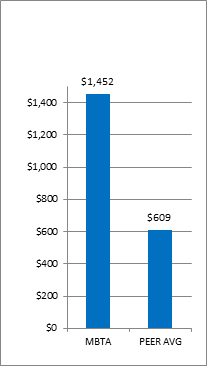
In figure 3 we provide a breakdown of capital funding received by the subject transit agencies from 1991 to 2013 based upon National Transit Database Urbanized Area (UZA) population data from the 2010 U.S. Census. The MBTA ranked first in total capital funding at $2,356 per capita, 68.9 percent higher than the peer group average of $1,395. The MBTA ranked first in state and local capital funding at $1,452 per capita, more than two times greater than the peer group average of $609. The MBTA ranked third in the group of six transit agencies in federal capital funding per capita, 15 percent higher than the average of the five peer transit agencies.
Figure 3: Capital Funding Per Capita, Total, Federal Share and State/Local Share, 1991-2013
| Transit Agency | Urban Area Population | Total Funds per capita | Federal Funds per capita | State/local Funds per capita |
|---|---|---|---|---|
| MBTA | 4,181,019 | $2,356 | $904 | $1,452 |
| SEPTA | 5,441,567 | $1,338 | $730 | $608 |
| CTA | 8,608,208 | $1,031 | $519 | $512 |
| WMATA | 4,586,770 | $2,116 | $1,382 | $733 |
| LACMTA | 12,150,996 | $597 | $224 | $373 |
| MTA | 2,203,663 | $1,891 | $1,072 | $819 |
| AVERAGE OF PEER GROUP | $1,395 | $785 | $609 | |
| MBTA VS PEER GROUP AVG | 168.9% | 115.0% | 238.4% | |
| MBTA RANK | 1 | 3 | 1 |
In figure 4 we compare the MBTA’s total capital funding per capita between 1991 and 2013 to the average of the five peer transit agencies, discussed above.
Figure 4: Total Capital Funds per capita, MBTA vs. Peer Group Average, 1991-2013
In figure 5 we compare the MBTA’s state and local capital funding per capita to the average of the five peer transit agencies over the same period.
Figure 5: State and Local Capital Funds per capita, MBTA vs. Peer Group Average, 1991-2013
An analysis of the INTDAS Peer Likeness group demonstrates that the MBTA has not been starved of capital funds. Moreover, the analysis strongly suggests that the MBTA’s substantially higher level of capital funds per capita (in its urbanized service area) has been due to very high state and local capital investment relative to other systems over the period studied (1991-2013).
Operating Funds
In figure 6 we present operating funding received by the MBTA and the five peer agencies fare revenue, and local, state and federal sources between 1991 and 2013.
Figure 6: Operating Funding, Total, Federal Share and State/Local Share, 1991-2013
| Transit Agency | Total Funds | Fares | Federal Funds | State/Local Funds |
|---|---|---|---|---|
| MBTA | $24,172,694,970 | $7,095,987,020 | $233,663,291 | $16,843,044,659 |
| SEPTA | $19,745,326,758 | $7,509,054,598 | $1,002,090,397 | $11,234,181,763 |
| CTA | $22,394,732,193 | $9,589,636,283 | $1,031,390,145 | $11,773,705,765 |
| WMATA | $23,675,183,506 | $10,165,310,848 | $615,973,833 | $12,893,898,825 |
| LACMTA | $20,233,046,676 | $5,374,620,873 | $2,839,803,222 | $12,439,494,938 |
| MTA | $8,419,099,973 | $2,366,275,909 | $556,653,878 | $5,496,170,186 |
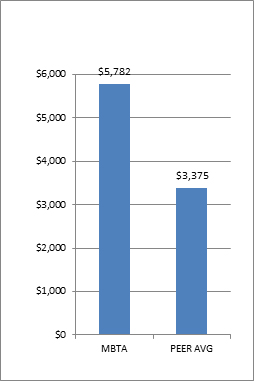
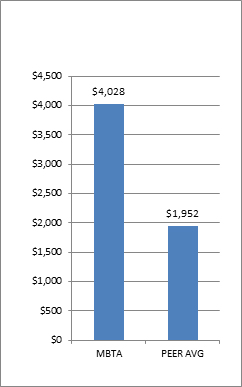
In figure 7 we provide a breakdown of operating funding received by the subject transit agencies from 1991 to 2013 based upon National Transit Database Urbanized Area (UZA) population data from the 2010 U.S. Census. The MBTA ranked first in total operating funding at $5,782 per capita, 71.3 percent higher than the peer group average of $3,375. The MBTA ranked first in state and local operating funding at $4,028 per capita, more than two times greater than the peer group average of $1,952. The MBTA ranked lowest in the group of six transit agencies in federal operating funding per capita, receiving only 30.2 percent of the average of the five peer transit agencies. In a future report we are going to examine the causes of the large disparity in operational funding of the MBTA by the state, including the impact of debt service and the T’s cost structure.
Figure 7: Operating Funding Per Capita, Total, Federal Share and State/Local Share, 1991-2013
| Transit Agency | Total Funds per capita | Federal Funds per capita | State/Local Funds per capita |
|---|---|---|---|
| MBTA | $5,782 | $56 | $4,028 |
| SEPTA | $3,629 | $184 | $2,065 |
| CTA | $2,602 | $120 | $1,368 |
| WMATA | $5,162 | $134 | $2,811 |
| LACMTA | $1,665 | $234 | $1,024 |
| MTA | $3,821 | $253 | $2,494 |
| AVERAGE OF PEER GROUP | $3,375 | $185 | $1,952 |
| MBTA VS PEER GROUP AVG | 171.3% | 30.2% | 206.4% |
| MBTA RANK | 1 | 6 | 1 |
In figure 8 we compare the MBTA’s total operating funding per capita between 1991 and 2013 to the average of the five peer transit agencies, discussed above.
Figure 8: Total Operating Funds per capita, MBTA vs. Peer Group Average, 1991-2013
In figure 9 we compare the MBTA’s state and local operating funding per capita to the average of the five peer transit agencies over the same period.
Figure 9: State and Local Operating Funds per capita, MBTA vs. Peer Group Average, 1991-2013
An analysis of the INTDAS Peer Likeness group demonstrates that the MBTA has not been starved of operating funds. Moreover, the analysis strongly suggests that the MBTA’s substantially higher level of per capita operating funds (in its urbanized service area) has been due to a very high state and local investment in its operating budget relative to other systems over the period studied (1991-2013).
All Funds (Capital and Operating)
Below are analyses undertaken on an “all funds” basis; that is, both capital and operating funds. In figure 10 we present total funding, including capital and operating funding, received by the subject transit agencies from fares and local, state and federal sources between 1991 and 2013.
Figure 10: Capital and Operating Funds, Total, Fares, Federal, State/Local, 1991-2013
| Transit Agency | Total Cap + Op Funds | Fares | Federal Cap + Op Funds | State/Local Cap + Op Funds |
|---|---|---|---|---|
| MBTA | $34,021,526,096 | $7,095,987,020 | $4,011,865,824 | $30,009,660,272 |
| SEPTA | $27,025,673,892 | $7,509,054,598 | $4,975,729,314 | $22,049,944,578 |
| CTA | $31,272,170,052 | $9,589,636,283 | $5,499,230,115 | $25,772,939,937 |
| WMATA | $33,380,695,828 | $10,165,310,848 | $6,957,169,271 | $26,423,526,557 |
| LACMTA | $27,485,331,709 | $5,374,620,873 | $5,560,672,559 | $22,345,531,507 |
| MTA | $12,585,718,054 | $2,366,275,909 | $2,918,511,577 | $9,667,206,477 |
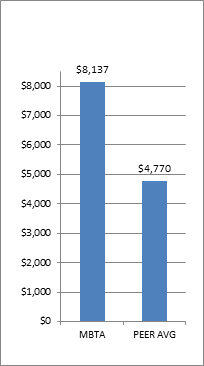
In figure 11 we provide a breakdown of total funding received by the subject transit agencies from 1991 to 2013, including fares and capital and operating funding, based upon National Transit Database Urbanized Area (UZA) population data from the 2010 U.S. Census. The MBTA ranked first in total funding at $8,137 per capita, 70.6 percent higher than the peer group average of $4,770. The MBTA ranked first in state and local capital funding at $5,480 per capita, more than twice the peer group average of $2,561. The MBTA ranked third in the group of six transit agencies in total federal capital and operating funding per capita, receiving 98.9 percent of the average of the five peer transit agencies.
Figure 11: Capital and Operating Funds per Capita, Total, Fares, Federal, State/Local, 1991-2013
| Transit Agency | Total Cap + Op Funds per capita | Fares per capita | Federal Cap + Op Funds per capita | State/Local Cap + Op Funds per capita |
|---|---|---|---|---|
| MBTA | $8,137 | $1,697 | $960 | $5,480 |
| SEPTA | $4,967 | $1,380 | $914 | $2,672 |
| CTA | $3,633 | $1,114 | $639 | $1,880 |
| WMATA | $7,278 | $2,216 | $1,517 | $3,545 |
| LACMTA | $2,262 | $442 | $458 | $1,397 |
| MTA | $5,711 | $1,074 | $1,324 | $3,313 |
| AVERAGE OF PEERS | $4,770 | $1,245 | $970 | $2,561 |
| MBTA VS PEER GROUP AVG | 170.6% | 136.3% | 98.9% | 214.0% |
| MBTA RANK | 1 | 2 | 3 | 1 |
In figure 12 we compare the MBTA’s total operating funding per capita between 1991 and 2013 to the average of the five peer transit agencies, discussed above.
Figure 12: All Funds per capita, 1991-2013
In figure 13 we compare the MBTA’s state and local operating funding per capita to the average of the five peer transit agencies over the same period.
Figure 13: State and Local Capital and Operating Funds per capita, MBTA vs. Peer Group Average, 1991-2013
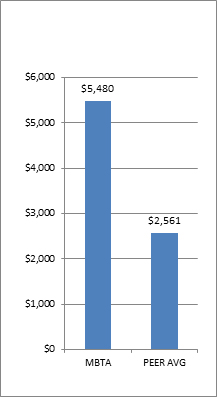
Once again, an analysis of the INTDAS Peer Likeness group demonstrates that the MBTA has seen, relative to other like systems, a very high level of investment when both capital and operating funds are included. The analysis strongly suggests that the MBTA’s substantially higher level of “all funds” per capita (in its urbanized service area) has been due to a very high state and local (as opposed to federal) investment, relative to other systems, over the period studied (1991-2013).
Conclusion
Since 1991, Massachusetts residents have paid more than twice as much per capita as the average for residents served by the MBTA’s five peer transit systems when both capital and operating funds are considered (figure 13). This extremely high level of state and local investment does not include fare revenues and federal capital and operating funds. In other words, our subsidies to the MBTA, including state and local subsidies in the form of capital and operating funding, are inordinately higher than those provided to the peer transit agencies identified by a federally funded database.
There are a number of reasons why this is the case, but let us cite two: First and foremost, the MBTA has undertaken capital projects and paid for them with state and local funds to a far greater degree than other transit systems have done. Secondly, the state has paid for much of the MBTA’s debt service whereas other agencies pay proportionately much more. As a 2011 MassDOT report, Beyond Boston: A Transit Study for the Commonwealth, stated, nearly half (49 percent) of operating funds received from the state are used for debt service. Indeed, that is why any analysis of MBTA spending must consider all sources of operating and capital funding, not just the traditional ones that appear on the revenue and expense balance sheet.
By any reasonable measure – capital, operating, or both – the MBTA has not been cash starved. And the residents of Massachusetts have paid far more to date, relative to those served by other like agencies, to ensure that the Authority has sufficient resources.
The focus of state and agency officials must be on system reforms to bring the MBTA to the point where it provides the high quality of service we are already paying for.

