Cheap, Efficient, Effective: The Lessons from the PVTA and WRTA
With its iconic light rail, extensive heavy rail, and comprehensive bus network providing 750,000 daily rides to nearly 200 municipalities, the MBTA is one of the largest and most iconic transit systems in the country. The T is not perfect, however, and has earned its fair share of criticism and concern. With this in mind, a comparison to the second and third largest transport systems in Massachusetts – the Pioneer Valley Transit Authority (PVTA) and the Worcester Regional Transit Authority (WRTA) – could shed light on the potential improvements for both the MBTA and the rest of the nation’s networks.
Two major caveats encountered when trying to compare these three distinct systems are the range of services and size of population served. The MBTA offers eight modes of transport to provide 214 million trips annually, 82 million of which are on its bus system alone. This is far greater than the six and three million trips serviced on just two methods for the PVTA and the WRTA, respectively. There have been several proposals to build additional transit infrastructure in these regions, however none have yet come to fruition.
Fares and Expenses
One of the first major differences lies in the cost to ride for passengers. While the PVTA and the MBTA charge similar bus fares of $1.70 and $1.50 per ride, the WRTA has been fare free since 2020. The intention behind WRTA’s fare-less system has been to increase ridership and decrease travel costs. However, there is concern about long-term funding for the project, as once pandemic relief funds run out, new taxes will have to be levied on Worcester residents to replace the fare revenue.

Figure 1: Percentage of operating funds received by source from 2021. Data is from the National Transit Agency annual agency profiles, organized by the Federal Transit Administration. Note: due to the pandemic, the percent of fare revenues for 2021 will be significantly different from non-pandemic levels.
The WRTA’s fare-free program has altered its revenue streams as well. Figure 1 breaks down each transit agencies’ 2021 funding sources for operations. We can see that state and local funding has had to expand to cover the roughly 13 percent of fare revenue lost from 2019.
The majority of funding for the regional authorities comes from the state – in contrast to the MBTA, which received exactly half of its funding from the federal government. This boost in federal funding comes from the Bipartisan Infrastructure Law put in place in 2021, which seeks to improve sustainability and accessibility. This is a notable outlier for the T, which has received little to no federal assistance in years prior – at most one percent from 2013.
Reliability and Upkeep
One similarity among the group is their performance and age. The three are remarkably similar when it comes to their reliability, with the WRTA’s on-time performance of 80 percent about five percentage points better than the others: 75 percent for the PVTA, and 75.9 percent for the MBTA’s average. The latter two share the exact same proportion of buses beyond their useful life – 32 percent – while the WRTA’s fleet is in slightly worse condition, at 38 percent beyond useful life. Their fleet ages are similar as well, with the average around eight to nine years old.
Efficiency and Effectiveness
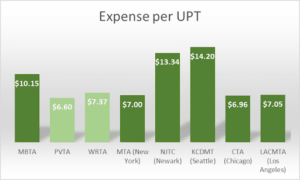
Figure 2: Expense per Unlinked Passenger Trip for selected bus networks. Data for non-Massachusetts cities comes from Pioneer’s MBTA Analysis tool, under Operating Efficiencies. The regional authorities are in light green for comparison.
The regional authorities are considerably more efficient than both the MBTA and other major transit authorities in the nation. Per Figure 2, the PVTA has the lowest cost per trip among those selected, with the WRTA still remaining competitive.
The regional authorities do perform similarly to other authorities when comparing costs per vehicle, however. Figure 3 shows that the WRTA spends more per vehicle than the New Jersey Transit Corporation, being comparable to the Chicago Transit Authority. The PVTA still remains as the most efficient of the group, having costs as low as 50 percent of New York’s.
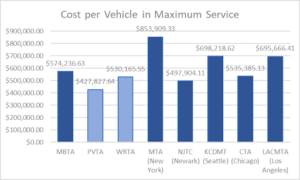
Figure 3: Cost per Vehicle in Maximum Service for selected bus networks. Data for non-Massachusetts cities comes from Pioneer’s MBTA Analysis tool, under Operating Efficiencies. The regional authorities are in light blue for comparison.
What the PVTA and WRTA lack in scale, they make up for in costs and efficiency. The MBTA is able to serve more travelers with more services, yet in turn incurs greater costs and lower efficiencies. While the extent of their operations is much smaller in scope, these regional authorities are able to boast higher efficiency and lower costs. Most importantly, these regional authorities provide crucial transportation services to smaller communities outside of the Greater Boston area.
Peter Mentekidis is a Roger Perry Transparency Intern with the Pioneer Institute. He is a rising senior at Providence College, with a major in Quantitative Economics and a minor in Philosophy. Feel free to contact via email, LinkedIn, or writing a letter to Pioneer’s office.

