
Massachusetts Tax Revenues Surpass Pre-Pandemic Levels
You heard it right, the state has too much money! In what one State House News Service reporter has called a “tax collection deluge,” the state has collected an enormous amount of money from taxpayers this year. All of this has people asking: where is all the money coming from?
Not only has revenue reached its pre-pandemic levels, but it has far surpassed them, even accounting for inflation. Compared to FY 2019, revenue is up by 38 percent according to the Pioneer Institute’s MassOpenBooks website, or 24.9 percent adjusted for inflation (using BLS inflation data).
Major Drivers of Growth
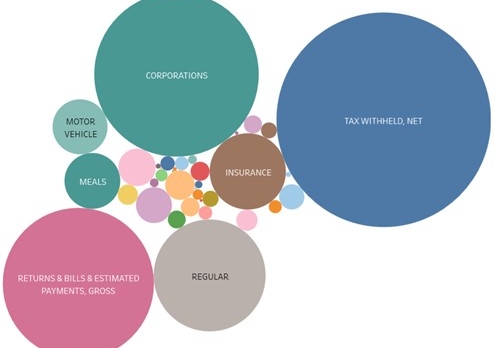
Figure 1: The relative size of Massachusetts revenue streams for the month of March 2022. The categories of “tax withheld, net” and “returns & bills & estimated payments, gross” are both part of personal income tax collection, which accounts for the majority of State tax revenue. Source: The Pioneer Institute’s MassOpenBooks Website.
The increase in personal income tax collections explains much of the increased revenue. Income taxes account for 54.3 percent of year-to-date (YTD) revenues so far. They are 40.1 percent compared to FY 2019 (See Figures 1 and 2).
The increased income tax revenue is not due to higher taxes. The income tax rate actually decreased from 5.05 percent in 2019 to 5 percent today. Therefore, something else is causing the revenue windfall.
Massachusetts residents must be bringing in significantly more money this year than in previous years. Whether that be from wage increases, job growth, industry change, or some other factor, it is a good sign for the economic prosperity in Massachusetts.
The second largest driver of increased revenue is the corporate excise tax. This tax has brought in about 10.1 percent of YTD revenues and increased by 47.8 percent since FY 2019, contributing a huge portion of revenue to state coffers.
Pandemic Recovery Indicators
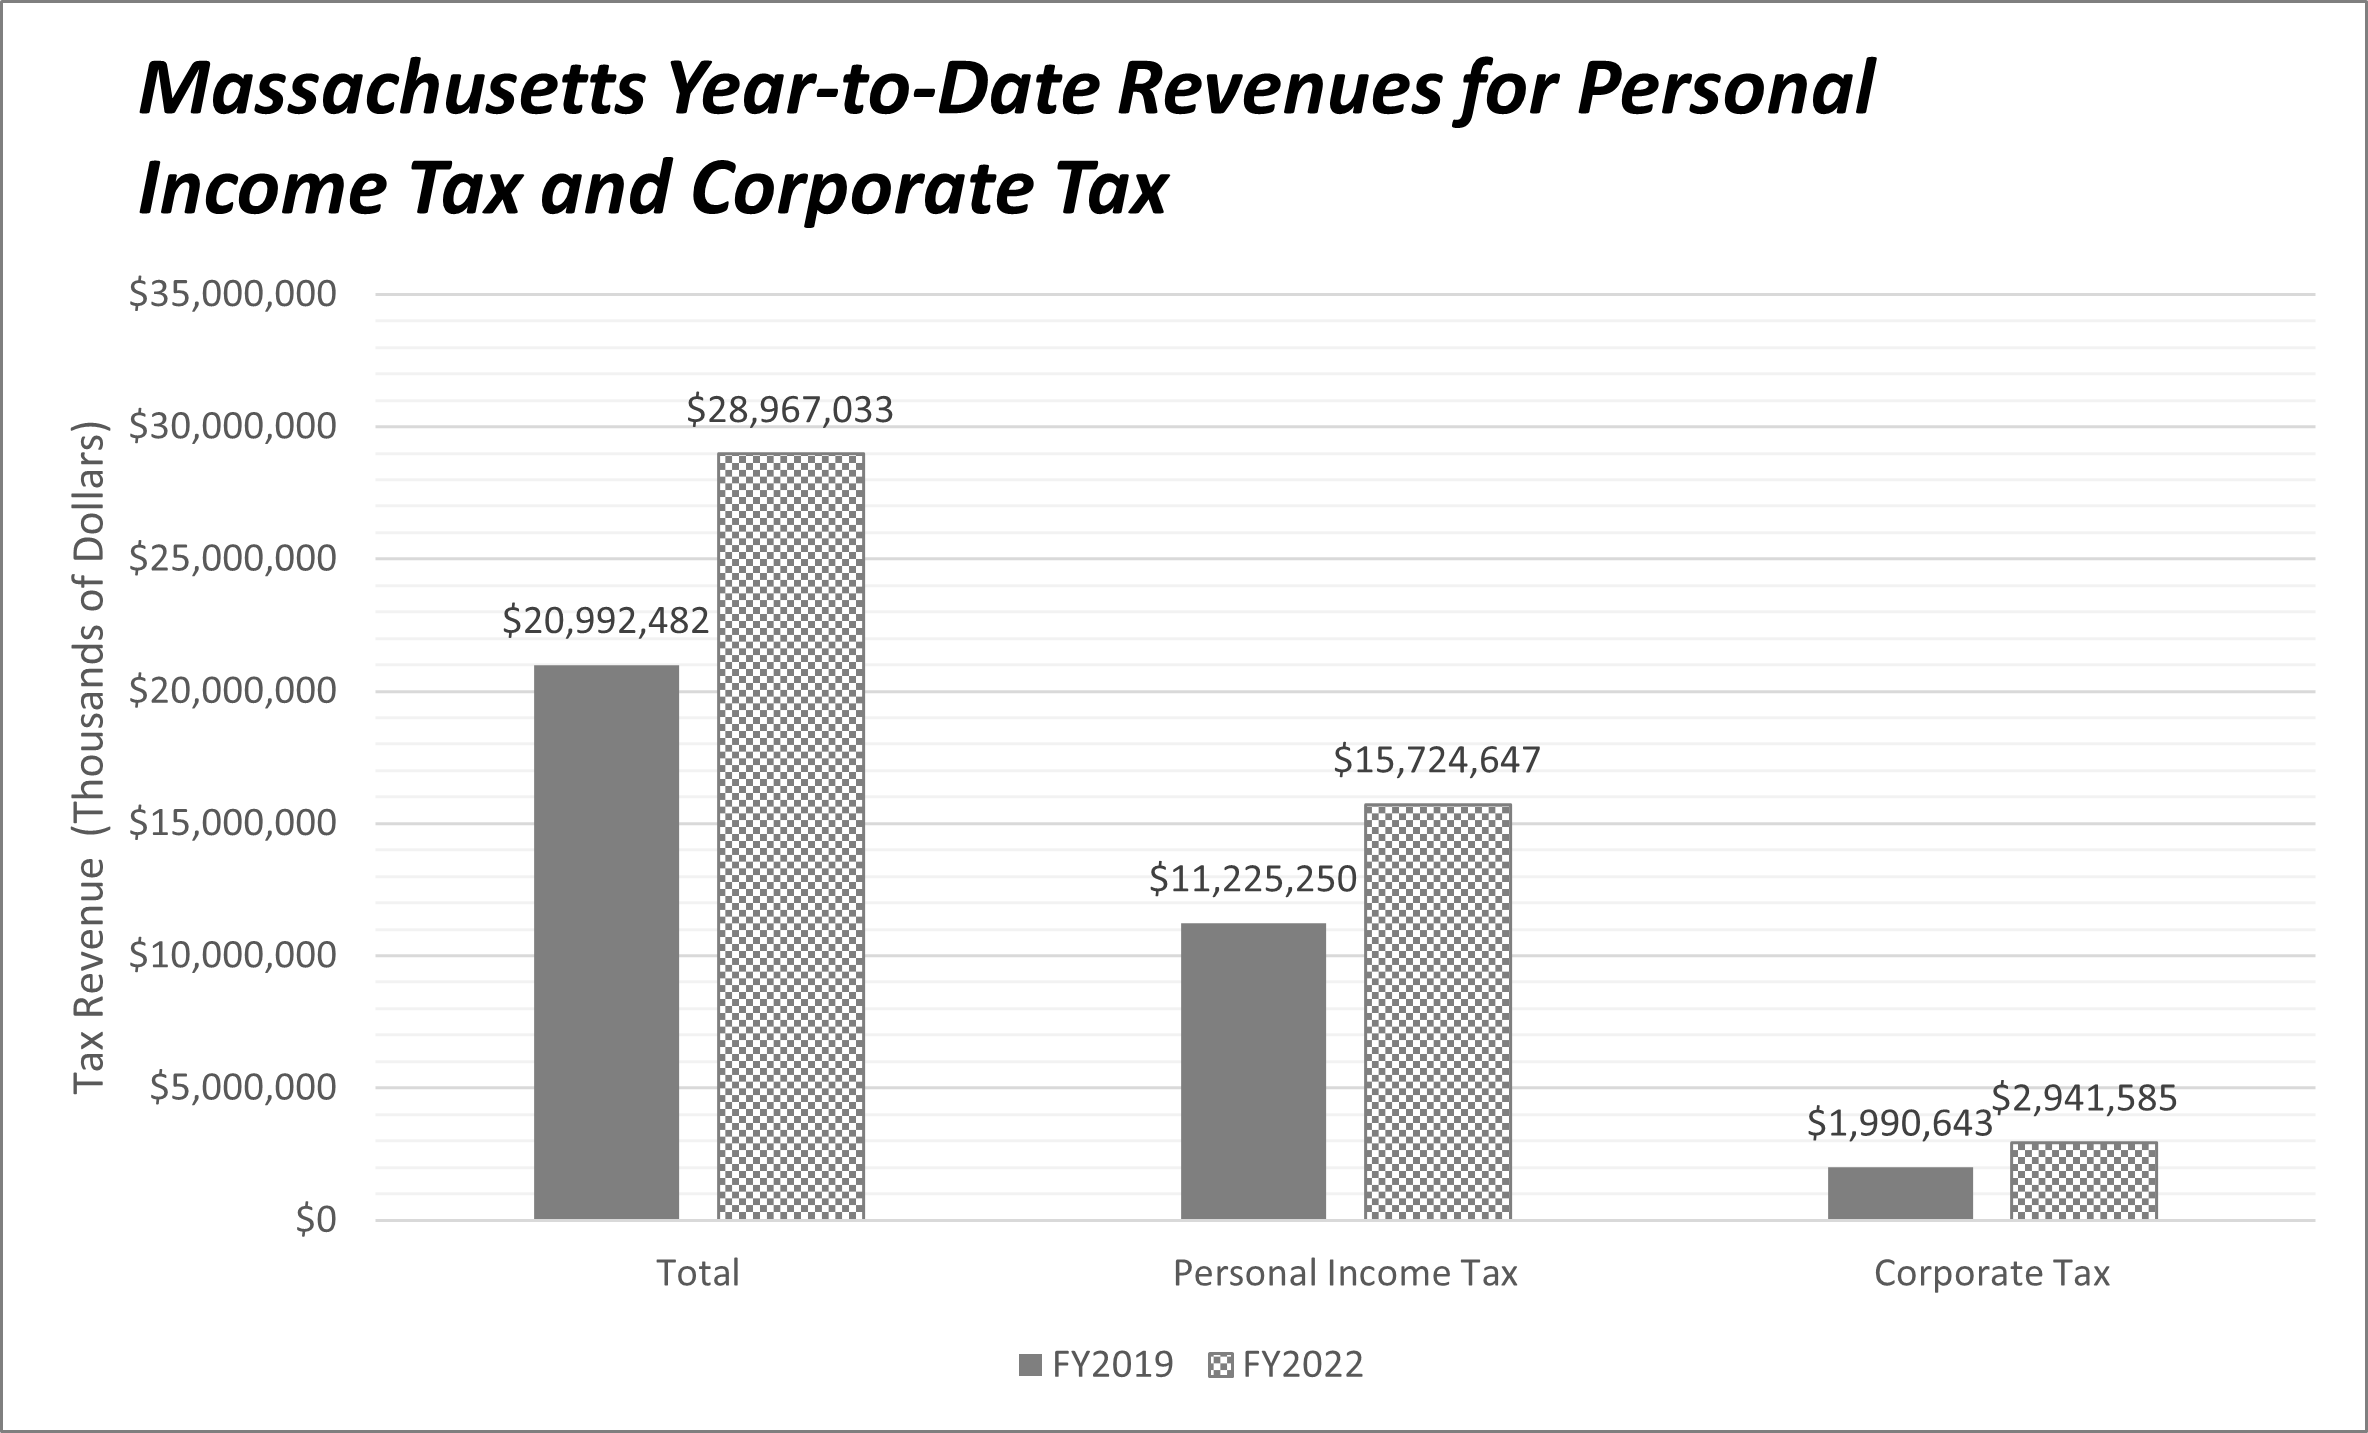
Figure 2: Massachusetts year-to-date (YTD) revenues for FY2019 and FY2022 in thousands of dollars. Source: The Pioneer Institute’s MassOpenBooks Website.
Revenue streams recovering from pandemic losses account for the rest of the increase. To assess this comeback,it is best to compare revenues for only the month of March because the recovery was less strong in the earlier months of this fiscal year (which runs from July 2021 to June 2022).
Revenue from the state’s room occupancy tax is one such stream that has fully recovered from its pandemic woes. Massachusetts charges a 5.7 percent excise tax on room rentals of 90 days or less at hotels, motels, B&B’s, and lodging houses. March revenue from this source alone is up by about 150 percent from FY 2021. But more importantly, revenue from this source is above its pre-pandemic level, with an increase of 24.3 percent over FY 2019 (11.3 percent adjusted for inflation).
The Commonwealth also has a 6.25 percent sales tax on meals purchased at restaurants. March revenue from the meals sales tax increased 60.7 percent compared to March of last year and 24.7 percent compared to pre-pandemic levels (FY 2019).
Revenue from the tax on alcoholic beverages sold at clubs has seen the most dramatic recovery of all. In March 2021, revenue from this tax was only $5,090, but it has increased 1,906 percent to $102,090. It is not a major contributor to the tax base, but it is a noteworthy recovery.
Take-Aways
Overall, this tax revenue analysis is encouraging. Examining the ways that state revenues are changing, shows how Massachusetts is changing. Revenue reflects major changes in workforce demand that have resulted in higher salaries and wages. It also shows how certain industries impacted by the pandemic are coming back to life.
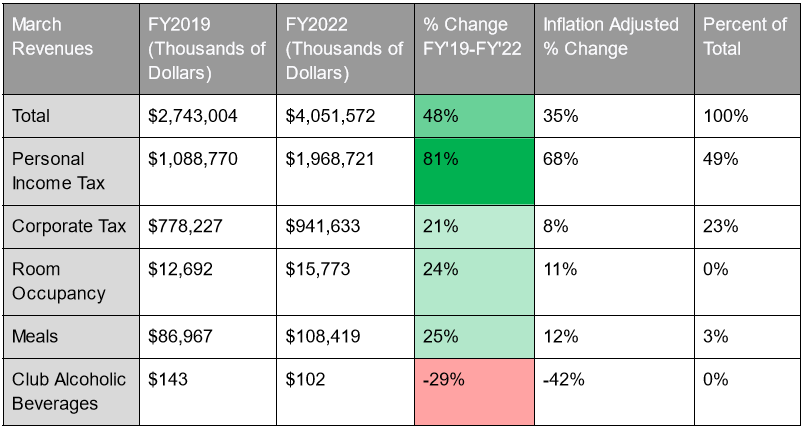
Figure 3: State of Massachusetts tax revenues in March only in thousands of dollars. March is the most recent month for which this data is available. YTD revenue is not sufficient for analysis because some effects of the pandemic were still underway during the earlier part of FY2022 (which runs from July 2021 to June 2022). Source: The Pioneer Institute’s MassOpenBooks Website.
About the Author:
Joseph Staruski is a government transparency intern with the Pioneer Institute. He is currently a Master of Public Policy Student at the University of Massachusetts, Amherst. He was previously an opinions columnist with the Boston College student newspaper The Heights and an Intern with the Philadelphia Public School Notebook. He has a BA in Philosophy and the Growth and Structure of Cities from Haverford College. Feel free to reach out via email, linkedin, or write a letter to Pioneer’s Office in Boston.
Related Content:
 https://pioneerinstitute.org/wp-content/uploads/Screenshot-2025-03-18-160808.png
464
781
Editorial Staff
https://pioneerinstitute.org/wp-content/uploads/logo_440x96.png
Editorial Staff2025-03-19 00:00:582025-03-18 16:34:57Pioneer Institute Study Finds Outdated U.S. Immigration System Delays Creation of 150,000 Businesses and 500,000 Jobs
https://pioneerinstitute.org/wp-content/uploads/Screenshot-2025-03-18-160808.png
464
781
Editorial Staff
https://pioneerinstitute.org/wp-content/uploads/logo_440x96.png
Editorial Staff2025-03-19 00:00:582025-03-18 16:34:57Pioneer Institute Study Finds Outdated U.S. Immigration System Delays Creation of 150,000 Businesses and 500,000 Jobs https://pioneerinstitute.org/wp-content/uploads/PNR-610-Final-cover-2.png
1801
3197
Editorial Staff
https://pioneerinstitute.org/wp-content/uploads/logo_440x96.png
Editorial Staff2025-03-10 11:44:252025-03-10 11:44:25The House Call – Cambridge Adopts a Zoning Ordinance Allowing 4 to 6-Story Residential Buildings Citywide
https://pioneerinstitute.org/wp-content/uploads/PNR-610-Final-cover-2.png
1801
3197
Editorial Staff
https://pioneerinstitute.org/wp-content/uploads/logo_440x96.png
Editorial Staff2025-03-10 11:44:252025-03-10 11:44:25The House Call – Cambridge Adopts a Zoning Ordinance Allowing 4 to 6-Story Residential Buildings Citywide https://pioneerinstitute.org/wp-content/uploads/getty-images-rId6IxvDc2M-unsplash-scaled.jpg
1702
2560
Editorial Staff
https://pioneerinstitute.org/wp-content/uploads/logo_440x96.png
Editorial Staff2025-03-06 09:43:552025-03-06 09:43:55Study: Inclusionary Zoning Helps Some, but Can Jeopardize Broad-Based Affordability
https://pioneerinstitute.org/wp-content/uploads/getty-images-rId6IxvDc2M-unsplash-scaled.jpg
1702
2560
Editorial Staff
https://pioneerinstitute.org/wp-content/uploads/logo_440x96.png
Editorial Staff2025-03-06 09:43:552025-03-06 09:43:55Study: Inclusionary Zoning Helps Some, but Can Jeopardize Broad-Based Affordability https://pioneerinstitute.org/wp-content/uploads/curated-lifestyle-ZRQBk8kVO38-unsplash-scaled.jpg
1951
2560
Editorial Staff
https://pioneerinstitute.org/wp-content/uploads/logo_440x96.png
Editorial Staff2025-02-19 19:09:342025-02-19 20:23:43Pioneer Institute Study Says MA Housing Permitting Process Needs Systemic Reform
https://pioneerinstitute.org/wp-content/uploads/curated-lifestyle-ZRQBk8kVO38-unsplash-scaled.jpg
1951
2560
Editorial Staff
https://pioneerinstitute.org/wp-content/uploads/logo_440x96.png
Editorial Staff2025-02-19 19:09:342025-02-19 20:23:43Pioneer Institute Study Says MA Housing Permitting Process Needs Systemic Reform https://pioneerinstitute.org/wp-content/uploads/Mass-migration-01132025-1.png
432
767
Editorial Staff
https://pioneerinstitute.org/wp-content/uploads/logo_440x96.png
Editorial Staff2025-02-13 13:13:062025-02-13 13:17:08Mapping Mass Migration – New 2024 Census Estimates Show Surge in Population Growth, With Considerable Caveats
https://pioneerinstitute.org/wp-content/uploads/Mass-migration-01132025-1.png
432
767
Editorial Staff
https://pioneerinstitute.org/wp-content/uploads/logo_440x96.png
Editorial Staff2025-02-13 13:13:062025-02-13 13:17:08Mapping Mass Migration – New 2024 Census Estimates Show Surge in Population Growth, With Considerable Caveats https://pioneerinstitute.org/wp-content/uploads/todd-kent-okF3hSKw9X8-unsplash-scaled.jpg
2048
2560
Editorial Staff
https://pioneerinstitute.org/wp-content/uploads/logo_440x96.png
Editorial Staff2025-02-11 07:00:272025-02-10 12:07:19Study Finds Bump in State Population Due to Changes in Census Bureau Methodology
https://pioneerinstitute.org/wp-content/uploads/todd-kent-okF3hSKw9X8-unsplash-scaled.jpg
2048
2560
Editorial Staff
https://pioneerinstitute.org/wp-content/uploads/logo_440x96.png
Editorial Staff2025-02-11 07:00:272025-02-10 12:07:19Study Finds Bump in State Population Due to Changes in Census Bureau Methodology https://pioneerinstitute.org/wp-content/uploads/Screenshot-2025-02-10-112601.png
1063
1915
Editorial Staff
https://pioneerinstitute.org/wp-content/uploads/logo_440x96.png
Editorial Staff2025-02-10 11:40:212025-02-10 11:42:06The House Call – Accessory Dwelling Units are Officially Legal Statewide in Massachusetts
https://pioneerinstitute.org/wp-content/uploads/Screenshot-2025-02-10-112601.png
1063
1915
Editorial Staff
https://pioneerinstitute.org/wp-content/uploads/logo_440x96.png
Editorial Staff2025-02-10 11:40:212025-02-10 11:42:06The House Call – Accessory Dwelling Units are Officially Legal Statewide in Massachusetts https://pioneerinstitute.org/wp-content/uploads/getty-images-e_7o47av_Ic-unsplash-scaled.jpg
1707
2560
Editorial Staff
https://pioneerinstitute.org/wp-content/uploads/logo_440x96.png
Editorial Staff2025-01-29 11:32:412025-02-12 15:57:05Pioneer Institute Study Compares MA Workforce Development System to Those in Peer States
https://pioneerinstitute.org/wp-content/uploads/getty-images-e_7o47av_Ic-unsplash-scaled.jpg
1707
2560
Editorial Staff
https://pioneerinstitute.org/wp-content/uploads/logo_440x96.png
Editorial Staff2025-01-29 11:32:412025-02-12 15:57:05Pioneer Institute Study Compares MA Workforce Development System to Those in Peer States https://pioneerinstitute.org/wp-content/uploads/Mass-migration-01212025-1.png
432
767
Editorial Staff
https://pioneerinstitute.org/wp-content/uploads/logo_440x96.png
Editorial Staff2025-01-21 13:48:552025-01-21 13:48:55Mapping Mass Migration: New England State and County Population Change, 2020 to 2023
https://pioneerinstitute.org/wp-content/uploads/Mass-migration-01212025-1.png
432
767
Editorial Staff
https://pioneerinstitute.org/wp-content/uploads/logo_440x96.png
Editorial Staff2025-01-21 13:48:552025-01-21 13:48:55Mapping Mass Migration: New England State and County Population Change, 2020 to 2023 https://pioneerinstitute.org/wp-content/uploads/Monthly-Musings-Jan-2025.png
432
767
Editorial Staff
https://pioneerinstitute.org/wp-content/uploads/logo_440x96.png
Editorial Staff2025-01-15 13:55:232025-01-15 13:56:30McAnneny’s January Musings – Legislative Transparency Takes Center Stage in the New Year
https://pioneerinstitute.org/wp-content/uploads/Monthly-Musings-Jan-2025.png
432
767
Editorial Staff
https://pioneerinstitute.org/wp-content/uploads/logo_440x96.png
Editorial Staff2025-01-15 13:55:232025-01-15 13:56:30McAnneny’s January Musings – Legislative Transparency Takes Center Stage in the New Year
