The Myth of the Underfunded MBTA
When the MBTA collapsed last month under the weight of snow and frigid temperatures, former General Manager Beverly Scott and countless others were quick to blame the problems on years of underinvestment in the system. But a comparison to other large transit systems reveals that the MBTA is not underfunded. In fact, as measured by both passenger miles traveled and vehicle revenue hours, the T received the most capital funding of any of the nation’s 10 largest transit systems between 1991 and 2013, the last year for which data are available.
Previously, we demonstrated that MBTA commuter rail capital spending per 1,000 passenger miles traveled was the highest of any major American commuter rail system between 1991 and 2013. This current analysis looks at capital investment from 1991 to 2013 across all modes. The analyses look at state, local, and federal funding for capital projects; that is, funding for investments like expansion and facilities upgrades. We analyze the funding amounts per passenger miles traveled (PMT) and by vehicle revenue hours (VRH).[1] Funding for MBTA capital improvements was the highest among the nation’s 10 largest agencies, whether calculated in terms of state and local funding for the Authority or in terms of total funding, including federal dollars.
As figure 1 shows, from 1991 to 2013 the MBTA ranked first among the nation’s 10 biggest transit agencies in capital funding per passenger miles traveled. State and local jurisdictions invested $16,276 per 100,000 passenger miles over that period. The state and local share of the MBTA’s capital funding was a considerable 37 percent higher than the average of the 10 biggest transit agencies ($11,873 per 100,000 passenger miles).
Figure 1. State and Local Capital Funding for 10 Top US Transit Agencies, per 100K PMT, 1991-2013

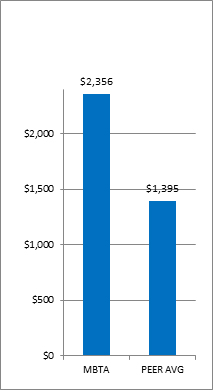
As figure 2 shows, from 1991 to 2013 the MBTA also ranked first in total capital funding, including federal capital funding, among the nation’s 10 biggest transit agencies, in terms of funding per passenger miles traveled. Over that period, state, local and federal jurisdictions made capital investments of $26,406 per 100,000 passenger miles. By this measure, the MBTA’s total capital funding was 29 percent higher than the average of the 10 biggest transit agencies ($20,490 per 100,000 passenger miles).
Figure 2. Total Capital Funding for 10 Top US Transit Agencies, per 100K PMT, 1991-2013

It is perhaps more useful to analyze capital spending per vehicle revenue hours, given that system costs are more directly related to the number of hours that vehicles are in service than the number of passengers boarding the vehicles. As figure 3 shows, from 1991 to 2013 the MBTA ranked first in state and local capital funding among the nation’s 10 biggest transit agencies in terms of spending per vehicle revenue hour. State and local jurisdictions invested $48,501 for every 1,000 vehicle revenue hours over that period. The state and local share of the MBTA’s capital funding was 45 percent higher than the average of the 10 biggest transit agencies ($33,345 per 1,000 vehicle revenue hours).
Figure 3. State and Local Capital Funding for 10 Top US Transit Agencies, per 1,000 VRH, 1991-2013

Finally, as figure 4 shows, from 1991 to 2013 the MBTA also ranked first in total capital funding, including federal capital funding, among the nation’s 10 biggest transit agencies, when analyzed in terms of vehicle revenue hours. Over that period, state, local and federal jurisdictions made capital investments of $78,687 per 1,000 vehicle revenue hours. By this measure, the MBTA’s total capital funding was 33 percent higher than the average of the 10 biggest transit agencies ($59,079 per 1,000 vehicle revenue hours).[2]
Figure 4. Total Capital Funding for 10 Top US Transit Agencies, per 1,000 VRH, 1991-2013
[1] PMT is defined as “the cumulative sum of the distances ridden by each passenger.” VRH is defined as “the hours that vehicles are scheduled to or actually travel while in revenue service; the figure includes layover / recovery time but excludes “deadhead, operator training, vehicle maintenance testing, and school bus and charter services.”
[2] Another metric that is sometimes used to measure the efficiency of transit system performance is funding per vehicle revenue mile. The MBTA ranked third among the ten transit systems by this measure, with total capital funding 22% higher than the average of the other nine transit systems per vehicle revenue mile, and state and local capital funding 30% higher than the average of the other nine transit systems per vehicle revenue mile.
