How to Save the MBTA Over $100 Million a Year
The first step in reforming the MBTA has been taken by the Legislature and the Governor. It included the establishment of a Finance and Management Control Board focused on the Authority’s operations as well as the new power to contract out services over a limited period of time.
The second step for the MBTA has to be addressing the issues of immediate and short-term concern such as transit safety and the maintenance, upgrade and repair of assets that will allow the MBTA to function throughout even a difficult winter.
Even as the work is underway, in order to ensure that the MBTA can address operational finance issues and make further investments and progress in addressing its multi-billion maintenance backlog, the MBTA must identify ways to streamline operations for cost-savings and efficiency.
This policy brief identifies three immediate measures the MBTA should be taking right now to take that third step. The suggestions are not meant to be exhaustive, but rather are suggestions to get that effort started. Cumulatively, the MBTA could garner $103 to $122 million a year in savings through these actions, even as it improves the quality of transit services. Click the button below to download a pdf version of this brief, or scroll down to read the rest below.
Recommendation 1: Terminate current contracts for The Ride and convert MBTA paratransit services to the model employed by the Human Services Transportation Office (HST) of the Executive Office of Health and Human Services (EOHHS) and Massachusetts Regional Transit Authorities.
Potential savings: $50.6-$69.5 million per year
As Figure 1 below shows, as of April 2014 there are three MBTA contracts for The Ride totaling $602,484,832 for the five-year period from FY2015 to FY2019. The contracts have a two-year extension option that brings the potential total to $916,199,999.
Figure 1. MBTA Contracts for The Ride, 2015-2019
| Area Definitions | FY2015-FY2019 | FY2020-FY2021 | Total |
| North area – Greater Lynn Senior Services (GLSS) | $188,031,199 | $99,037,766 | $287,068,965 |
| West area -Veterans Transportation, LLC | $237,873,956 | $123,631,460 | $361,505,416 |
| South area -National Express Transit Corporation (NE) | $176,579,677 | $91,045,941 | $267,625,618 |
| Totals | $602,484,832 | $313,715,167 | $916,199,999 |
To provide a better cost picture for The Ride relative to the value of its contracts, we compare the costs of its service to HST’s demand-response paratransit service, used for MassHealth non-emergency transportation.
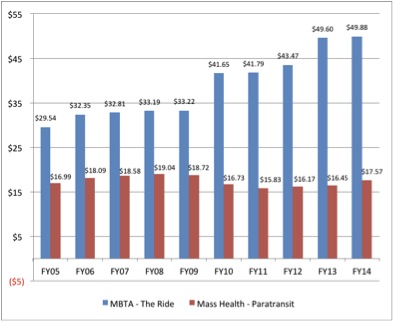
In FY2014, The Ride provided paratransit passengers with 2,223,700 one-way trips at a cost of $105,923,101—an average per trip cost of $49.88. By comparison, HST’s demand-response paratransit service provided 3,000,327 passenger trips at a cost of $54,427,745 that year—an average of $17.57 per trip. This amount is virtually one-third the cost per trip of The Ride. HST produces savings in addition to the per-trip rate because, unlike the MBTA, it does not provide its transportation vendors with taxpayer-supplied vans and vehicles.
HST’s success is largely attributable to its operational service model and its long-standing commitment to cost-effectiveness and innovation. HST uses a model under which a paratransit broker contracts with 364 different transportation companies, primarily cab companies that compete for MassHealth clients on a price-per- trip basis. The broker is responsible for scheduling, reservations and dispatching vehicles. Since 86 percent of HST MassHealth paratransit trips do not require wheelchair-accessible vehicles, local cab companies and drivers who have passed background checks provide most of the HST service. More than 80 percent of The Ride’s clientele also do not need wheelchair compatible vehicles.
HST’s FY2014 annual report explains that it contracts with select Regional Transit Authorities (RTAs) that function as brokers in nine distinct HST areas, encompassing all cities and towns within the commonwealth. Each HST broker administers transportation services by subcontracting with qualified transportation providers in their HST area(s). In contrast, the MBTA awards exclusive paratransit contracts to three vendors, each of which is responsible for a large service area. The three operate jointly in the core area of Boston, Brookline, Cambridge, and Somerville.
Figure 2 shows the operating expense per passenger trip for The Ride and HST MassHealth demand-response paratransit service.
Figure 2. Operating Expense per Passenger Trip: The Ride and HST MassHealth, 2005-2014
Another element of The Ride contracts that is counterproductive to cost-containment is a provision that allows The Ride contractors, not the MBTA, to control reservations, scheduling and trip planning. This provision of the MBTA’s contract creates an inherent financial disincentive for the provider to maximize ride sharing since the T pays the provider a fixed amount per trip regardless of how many passengers are on board. In other words, the contractors make more money by avoiding shared rides. According to HST’s FY2014 annual report, there was more than one passenger on board for all or part of 64.5 percent of its total trips. NTD data indicates that in 2013, The Ride had an average of 0.89 passengers on board a paratransit vehicle per vehicle revenue mile.
The MBTA’s contracts for The Ride also include a provision stating that the agency is considering a centralized call and control center. During the first three years of the contracts, the service providers will continue to handle reservations, scheduling and dispatching, along with their other responsibilities for delivering service. This responsibility may continue in years four and five, and into the option period if exercised. If the MBTA pursues a change, the call and control center would likely be established by the beginning of year four, with service provider reservations, scheduling and dispatching functions transferred during that year. The centralized call and control center would be managed by a paratransit call and control center management firm retained by the MBTA under a separate procurement.
Another provision of the contract provides that if the MBTA centralizes its paratransit call center function, the T service providers will be paid a fixed amount per van ride and another for a sedan ride.
If the MBTA establishes a centralized call center in 2018 or later, it would benefit by paying a lesser rate when sedans are used, rather than a higher per-trip rate. Much of this benefit, however, would be negated by the fact that the current service providers have a sedan per-trip contract already in place. So long as the MBTA gives sole providers exclusive rights in each district, it will never be able to reap the financial benefits of the broker operational model that has benefitted HST.
A second major reason why HST’s paratransit service is more cost effective than The Ride is that it operates on a curb-to-curb rather than a door-to-door basis. Curb-to-curb service saves time by eliminating the time-consuming and expensive requirement that the driver park the vehicle and accompany a passenger door-to-door when it is not necessary to do so. ADA regulations allow paratransit operators to offer curb-to-curb service, so long as the driver assists passengers door-to-door when requested or otherwise needed. This is the level of service that HST requires its transportation vendors to provide. A Federal Transit Administration guidance document explains: “ADA regulation 49 CFR §37.129(a) provides that, with the exception of certain situations in which on-call bus service or feeder paratransit service is appropriate, complementary paratransit service for ADA paratransit eligible persons shall be origin- to-destination service.” This term was deliberately chosen to avoid using either the terms “curb-to-curb” or “door-to-door” service and to emphasize the obligation of transit providers to ensure that eligible passengers are actually able to use paratransit service to get from their point of origin to their point of destination.” The MBTA’s three paratransit contracts state that “the Contractor will provide door-to-door service to the maximum extent possible without losing control and oversight of vehicles or other customers.” A 2011 report issued by the New York City Transit Paratransit Division states that eight of its 14 peer transit agencies use curb-to-curb rather than door-to-door service.
If the MBTA switches to a paratransit broker/curb-to-curb model like HST uses and is able to reduce its per-trip cost to HST’s level, its annual paratransit savings would be considerable. The draft contract seems to allow the MBTA to do so. A provision of the draft contract included in the Request for Proposal (RFP) provides that: “The Authority may cancel this Contract, without cause, upon thirty (30) days written notice to the Contractor (“Termination for Convenience”).”
Savings if The Ride were to operate under the HST or RTA model
Figures 3 through 5 present projections of the savings that could be achieved between FY2016-FY2021 if The Ride were able to reduce its per-passenger ride cost to that of the average RTA or MassHealth’s HST demand-response paratransit system. Figures 3 and 4 provide projected annual passenger trips and the annual budgets for The Ride, the RTAs and HST. These are taken from the MBTA’s 2014 RFP for paratransit providers FY2015- FY2021. The RTA and HST per-trip rates use FY2013 as a base and increase by 4 percent annually. The Ride’s per-trip rates are calculated from the 2014 RFP by dividing the annual budget by projected passenger trips as described in the RFP.
Figure 3. Projected Passenger Trips and Service Costs per Passenger Trip, 2016-2021
| FY2016 | FY2017 | FY2018 | FY2019 | FY2020 | FY2021 | |
| Projected trips per RFP | 2,099,058 | 2,219,858 | 2,350,951 | 2,482,044 | 2,613,137 | 2,744,231 |
| The Ride ($ per trip) | $52.85 | $53.77 | $54.71 | $55.67 | $57.56 | $59.51 |
| HST MassHealth ($ per trip) | $19.76 | $20.55 | $21.38 | $22.23 | $23.12 | $24.05 |
| RTA average $ (per trip) | $28.76 | $29.91 | $31.10 | $32.35 | $33.64 | $34.99 |
Figure 4. Annual Total Costs for The Ride, RTAs, and HST, millions, 2016-2021
| Comparative Service | FY2016 | FY2017 | FY2018 | FY2019 | FY2020 | FY2021 | Totals |
| The Ride* | $110.9 | $119.4 | $128.6 | $138.2 | $150.4 | $163.3 | $810.8 |
| RTA | $60.4 | $66.4 | $73.1 | $80.3 | $87.9 | $96.0 | $464.1 |
| HST MassHealth | $41.5 | $45.6 | $50.3 | $55.2 | $60.4 | $66.0 | $319.0 |
Figure 5 shows projected savings if The Ride were to operate at the efficiency of the average RTA or MassHealth’s HST. If The Ride’s cost per passenger trip was reduced to the average of the RTAs, the savings would be $346.8 million over six years. If cost per passenger trip was reduced to the level of MassHealth’s HST demand-response paratransit system, the savings would be $491.9 million over six years.
Figure 5. Savings Calculated by RTA and HST Efficiency, millions, 2016-2021
| Comparative Service | FY2016 | FY2017 | FY2018 | FY2019 | FY2020 | FY2021 | Totals |
| The Ride vs RTAs | $50.6 | $53.0 | $55.5 | $57.9 | $62.5 | $67.3 | $346.8 |
| The Ride vs HST MassHealth | $69.5 | $73.7 | $78.4 | $83.0 | $90.0 | $97.3 | $491.9 |
Recommendation 2: Put MBTA bus maintenance out to competitive procurement.
Potential savings: $49.7 million per year.
The principal reason for the MBTA’s high cost of directly provided bus service is its high bus maintenance costs. Of 425 bus transit agencies in the US in 2013, the MBTA had the highest bus maintenance cost per hour of bus operation. This cost is attributable in large part to its high maintenance staffing and labor hours per vehicle mile: the MBTA has 59.6 percent more full-time bus maintenance personnel per bus mile than the average of its five peer agencies, as designated by the Federal Transit Administration (FTA) and incorporated in the FTA-sponsored Integrated National Transit Database Analysis System (INTDAS). Its maintenance costs per bus mile are 92.2 percent higher than its five peer agencies, and its labor hours per vehicle mile are 65.7 percent higher than the average of its peer agencies.
Bus Repair and Maintenance Cost Efficiency, the MBTA versus INTDAS Peers
Figures 6 through 12 compare the MBTA’s vehicle maintenance cost efficiency with that of five other systems designated by INTDAS as peer bus transit agencies. The goal of this analyses is to understand what has driven the elevated maintenance costs at the MBTA.
In this section and the section below, we explore a number of potential drivers of the T’s elevated costs for maintenance, including differences in work hours dedicated to bus maintenance, the number of full-time equivalent (FTE) employees dedicated to bus maintenance, vehicle age, annual vehicle miles, annual vehicle hours, and capital investments. In doing so, we use a variety of comparisons, including comparisons to the MBTA’s INTDAS-designated peer transit agencies, vehicle maintenance work hours per vehicle revenue mile and revenue hour, single-year 2013 data (the latest data currently available) and 2004-2013 longitudinal data to ensure that any inferences based on 2013 numbers are not the result of outlier data in 2013.
Figure 6 shows that the MBTA had the highest maintenance cost per vehicle revenue mile (VRM) in 2013 at $4.57, 92.2 percent higher than the $2.38 average of the five peer agencies. Had the MBTA reduced its total bus maintenance expenses per revenue mile in 2013 to the average level of its five INTDAS peers, it would have saved $49.8 million dollars in 2013. Over the 10-year period from 2004 and 2013, the MBTA incurred bus maintenance costs per mile of $3.39, 44.8 percent higher than that of its five peer agencies. Had the MBTA operated at the average maintenance cost per revenue mile of its peer agencies over that period, it would have saved more than $250 million dollars.
Figure 6. Vehicle maintenance cost per revenue mile, MBTA compared to INTDAS peers, 2013 and 2004-2013
| Transit Agency | Maintenance /VRM 2013 | Maintenance/VRM 2004-2013 |
| Boston – MBTA | $4.57 | $3.39 |
| Philadelphia – SEPTA | $2.55 | $2.14 |
| Washington, D.C. – WMATA | $2.99 | $3.14 |
| Baltimore – MTA | $2.13 | $2.72 |
| Atlanta – MARTA | $2.03 | $1.74 |
| Miami – MDT | $2.18 | $1.99 |
| AVERAGE 5 PEERS | $2.38 | $2.34 |
| MBTA | Maintenance /VRM 2013 | Maintenance/VRM 2004-2013 |
| MBTA above peer average/VRM | $2.19 | $1.05 |
| MBTA % above peer average/VRM | 92.2% | 44.8% |
| MBTA VRM | 22,719,357 | 240,272,542 |
| MBTA savings if at peer average | $49,777,067 | $252,235,474 |
Figure 7 presents a maintenance cost analysis on the basis of vehicle revenue hours. Again, as the figure shows, the MBTA had the highest maintenance cost per revenue hour in 2013 at $45.44, 71.3 percent higher than the $26.52 average of the five peer agencies. Had the MBTA reduced its total bus maintenance expenses per revenue hour in 2013 to the average of its five INTDAS peers, it would have saved $43.2 million dollars. Over the 10-year period from 2004 and 2013, the MBTA had bus maintenance costs per hour of $34.87, 31.3 percent higher than its five peer bus agencies. Had the MBTA operated at the average cost per revenue hour of its peer agencies over that period, it would have saved $194.3 million dollars.
Figure 7. Bus maintenance expense per revenue hour, MBTA compared to INTDAS peers, 2004-2013
| Transit Agency | Maintenance /VRM 2013 | Maintenance/VRM 2004-2013 |
| Boston – MBTA | $45.44 | $34.87 |
| Philadelphia – SEPTA | $26.08 | $21.96 |
| Washington, D.C. – WMATA | $31.27 | $34.17 |
| Baltimore – MTA | $24.72 | $31.10 |
| Atlanta – MARTA | $24.73 | $21.47 |
| Miami – MDT | $25.78 | $24.10 |
| AVERAGE 5 PEERS | $26.52 | $26.56 |
| MBTA | Maintenance /VRM 2013 | Maintenance/VRM 2004-2013 |
| MBTA above peer average/VRM | $18.92 | $8.31 |
| MBTA % above peer average/VRM | 71.3% | 31.3% |
| MBTA VRM | 2,283,137 | 23,389,797 |
| MBTA savings if at peer average | $43,195,146 | $194,284,769 |
One reason for the MBTA’s extraordinarily high bus maintenance costs is its high number of annual bus maintenance work hours compared to those of its INTDAS peer bus agencies. Figure 8 shows that the MBTA had the greatest number of maintenance work hours per vehicle revenue mile of the INTDAS peer agencies in 2013 at 57.2 hours per 1,000 vehicle revenue miles. This is 65.7 percent higher than the 34.5 hour average of its peer agencies.
Had the MBTA reduced its total bus maintenance work hours per vehicle revenue mile in 2013 to the average of its five INTDAS peers, it would have reduced its total work hours by more than 500,000. Looking back five years earlier, we see that the same phenomenon occurred in 2009, when the MBTA incurred 49.7 percent more work hours per revenue mile than its peer agencies. In that year, the MBTA paid its bus maintenance employees to provide 50.3 hours of maintenance work per 1,000 revenue miles compared to the average of its peers, 35.9 hours.
As the subsequent charts show, the average MBTA bus was 15 days older than the average of its INTDAS peers in 2009 and 43 weeks older than its peers in 2013. The same disproportionately high number of work hours per vehicle hour occurred five years earlier in 2009, when the MBTA paid for 60.6 bus maintenance work hours per 100 revenue hours of bus operations while its peer agencies needed an average of only 40.5 hours, which is 49.7 percent fewer. Had the MBTA reduced its total bus maintenance work hours per vehicle revenue hour in 2009 to the average of its five INTDAS peers, it would have reduced its total work hours by more than 450,000.
Figure 8. Bus maintenance work hours per revenue mile and revenue hour, MBTA compared to INTDAS peers, 2009 and 2013
| Transit Agency | Work hours/1K VRM 2013 | Work hours/1K VRM 2009 | Work hours/100 VRH 2009 | Work hours/100 VRH 2013 |
| Boston – MBTA | 57.2 | 50.3 | 52.59 | 60.61 |
| Philadelphia – SEPTA | 38.0 | 39.1 | 40.19 | 39.33 |
| Washington, D.C. – WMATA | 43.4 | 36.9 | 39.98 | 45.03 |
| Baltimore – MTA | 37.2 | 41.5 | 47.83 | 41.01 |
| Atlanta – MARTA | 29.5 | 29.6 | 36.90 | 42.94 |
| Miami – MDT | 24.4 | 32.5 | 39.01 | 34.06 |
| AVERAGE 5 PEERS | 34.5 | 35.9 | 40.8 | 40.5 |
| MBTA | Work hours/1K VRM 2013 | Work hours/1K VRM 2009 | Work hours/100 VRH 2009 | Work hours/100 VRH 2013 |
| MBTA above average of peers | 65.7% | 40.1% | 29.0% | 49.7% |
| MBTA VRM, VRH | 24,194,260 | 23,824,480 | 2,279,516 | 2,283,137 |
| MBTA work hours | 1,383,740 | 1,198,769 | 1,198,769 | 1,383,740 |
| MBTA hours in excess of peer average hours per VRM and VRH |
548,544 |
343,374 |
269,139 |
459,612 |
Another reason for the MBTA’s high bus maintenance costs is the high staffing level of its bus maintenance division compared with that of its INTDAS peer bus agencies.
Figure 9 demonstrates that the MBTA had the greatest number of full-time maintenance employees per vehicle revenue mile of the INTDAS peer group in 2013. The MBTA’s staffing rate of 2.9 employees per 100,000 vehicle revenue miles was 59.6 percent more than the 1.8 employee average of its peer agencies. The inverse way to express this statistic is to say that the average peer agency had 37.3 percent fewer employees per revenue mile in 2013 than the MBTA had. The next closest agency with respect to staffing per vehicle mile in the peer group was Washington, D.C.’s WMATA bus transit system, which employed 2.3 maintenance employees per revenue mile, 20 percent less per revenue mile and 22 percent less per revenue hour than the MBTA. The MBTA employs 710 full-time employees in its bus division—in order to match the staffing level of WMATA, the MBTA would have needed to reduce its full time bus maintenance staffing by more than 140 employees.
Looking back five years, we see that the same phenomenon was already occurring then. In 2009, the MBTA employed 49.4 percent more employees per revenue mile than its peer agencies did. High MBTA staffing levels are evidenced by a comparison of maintenance employees per bus revenue hour, with the MBTA exceeding the average of its peer agencies by 44.9 percent and 37.7 percent in 2013 and 2009 respectively.
Figure 9. Bus maintenance employee count per revenue mile and revenue hour, MBTA compared to INTDAS peers, 2009 and 2013
| Transit Agency | Employee count/100K VRM 2013 | Employee count/100K VRM 2009 | Employee count/10K VRH 2013 | Employee count/100K VRH 2009 |
| Boston – MBTA | 2.9 | 2.8 | 3.1 | 2.9 |
| Philadelphia – SEPTA | 2.1 | 2.0 | 2.2 | 2.1 |
| Washington, D.C. – WMATA | 2.3 | 2.1 | 2.4 | 2.3 |
| Baltimore – MTA | 2.0 | 2.0 | 2.2 | 2.3 |
| Atlanta – MARTA | 1.4 | 1.5 | 2.1 | 1.9 |
| Miami – MDT | 1.3 | 1.7 | 1.9 | 2.0 |
| AVERAGE 5 PEERS | 1.8 | 1.9 | 2.1 | 2.1 |
| MBTA | Employee count/100K VRM 2013 | Employee count/100K VRM 2009 | Employee count/10K VRH 2013 | Employee count/100K VRH 2009 |
| MBTA above average of peers | 59.6% | 49.4% | 44.9% | 37.7% |
| MBTA VRM, VRH | 24,194,260 | 23,824,480 | 2,283,137 | 2,279,516 |
| MBTA full time employee count | 710 | 665 | 710 | 665 |
| MBTA FTEs in excess of peer average | 265.1 | 219.9 | 219.8 | 182.1 |
An explanation often given for the operational failures of the MBTA last winter is that the MBTA’s vehicle fleet is worn out and that the MBTA has not made adequate capital investment in fleet equipment. Given the data previously presented herein, including data showing that that the MBTA’s bus maintenance expenses were 44.8 percent higher than its INTDAS peers per vehicle mile between 2004 and 2013, the following data about the age, mileage, and capitalization of the buses further refute the claim that critical systems failures were a result of insufficient capital investment.
Another possible explanation for the MBTA’s high vehicle maintenance costs is that its buses are much older than those of its peers. Figure 10 presents NTD data about the age of the MBTA’s active bus fleet in comparison with that of its INTDAS peers. Over the most recent 10-year period reported by NTD, 2004-2013, the average age of an active MBTA bus was 8.01 years compared to the INTDAS peer group average of 7.18 years, which translates to a difference of approximately 10 months. For the most recent eight-year period, the average age of an active MBTA bus was 7.11 years compared to the INTDAS peer group average of 7.07 years, which means that the MBTA’s buses were on average 14 days older during this period. It seems unlikely that these small differences could be responsible for overall maintenance cost differences of the magnitude previously described.
Figure 10. Average age of bus fleet, MBTA compared to INTDAS peers, 2004-2013 and 2006-2013
|
Transit Agency |
Ave. Age of Active Fleet 2006-2013 | Ave. Age of Active Fleet 2004-2013 |
| Boston – MBTA | 7.11 | 8.01 |
| Philadelphia – SEPTA | 7.33 | 7.16 |
| Washington, D.C. – WMATA | 7.46 | 7.78 |
| Baltimore – MTA | 7.09 | 7.33 |
| Atlanta – MARTA | 6.69 | 6.46 |
| Miami – MDT | 6.74 | 6.33 |
| AVERAGE 5 PEERS | 7.07 | 7.18 |
| MBTA older than peer agency average (years) | 0.04 | 0.83 |
| MBTA older than peer agency average (days) | 14 | 302 |
Another possible explanation for the MBTA’s high vehicle maintenance costs is that the MBTA’s capital investment in buses has been substantially less than that of its peer agencies. Figure 11 presents NTD data demonstrating that the MBTA’s capital expenditures for buses over the past 10-year period exceeded its INTDAS peers, on average. The MBTA’s capital expenditures exceeded the average of the peer group by $156,369 per bus operated in maximum service during the years 2004-2013—34.5 percent more than the average of the peer agencies. The MBTA exceeded the average of the peer group by $74,090 per active fleet bus from 2004-2013, which is 19.7 percent more than the average of the peer agencies.
Figure 11. Capital investment in buses by transit agency, MBTA compared to INTDAS peers, 2004-2013
| Transit Agency | Capital expenditures/ buses in max. service | Capital expenditures/ active bus fleet |
| Boston – MBTA | $609,779.47 | $451,020.32 |
| Philadelphia – SEPTA | $523,994.60 | $446,127.08 |
| Washington, D.C. – WMATA | $596,398.01 | $506,258.85 |
| Baltimore – MTA | $620,144.91 | $494,043.02 |
| Atlanta – MARTA | $288,115.03 | $242,800.24 |
| Miami – MDT | $238,399.54 | $195,423.10 |
| AVERAGE 5 PEERS | $453,410.42 | $376,930.46 |
| MBTA | Capital expenditures/ buses in max. service | Capital expenditures/ active bus fleet |
| MBTA above peer average/VOM | $156,369.05 | $74,089.86 |
| MBTA average # of VOMS | 775 | 1,048 |
| MBTA % above peer average | 34.50% | 19.70% |
Another potential explanation for the MBTA’s high maintenance costs assumes the MBTA’s bus mileage is higher than its peers, measured by revenue miles and revenue hours per year of bus service. Figure 12 presents data from the NTD showing the average total mileage per bus over the past ten years and over the past eight years. The MBTA’s total revenue mileage per vehicle operated in maximum service was 310,029 miles between 2004 and 2013, 16.4 percent less than the average of the INTDAS per group agencies: 370,888 revenue miles. The MBTA’s buses also had 8.1 percent fewer total hours of operation than the average of the peer agencies’ buses between 2004 and 2013.
Figure 12. Average mileage and hours of operation of buses, MBTA compared to INTDAS peers, 2004-2013 and 2006-2013
| Transit Agency | Ave. VRM per VOM 2004-2013 | Ave. VRM per VOM 2006-2013 | Ave. VRH per VOM 2004-2013 | Ave. VRH per VOM 2006-2013 |
| Boston – MBTA | 310,029 | 247,331 | 30,180 | 24,128 |
| Philadelphia – SEPTA | 340,606 | 272,696 | 33,179 | 26,619 |
| Washington, D.C. – WMATA | 308,646 | 246,077 | 28,351 | 22,781 |
| Baltimore – MTA | 346,867 | 283,656 | 30,302 | 24,661 |
| Atlanta – MARTA | 495,977 | 406,897 | 40,218 | 32,969 |
| Miami – MDT | 423,202 | 331,369 | 34,874 | 27,458 |
| AVERAGE 5 PEERS | 370,888 | 298,004 | 32,851 | 26,436 |
| MBTA | Ave. VRM per VOM 2004-2013 | Ave. VRM per VOM 2006-2013 | Ave. VRH per VOM 2004-2013 | Ave. VRH per VOM 2006- 2013 |
| MBTA versus average of peers | -16.4% | -17.0% | -8.1% | -8.7% |
The data presented above indicates that the leading causes of the MBTA’s extraordinarily high bus maintenance costs are its excessive annual bus maintenance work hours and staffing levels compared to its INTDAS peer bus agencies.
Additional causes of high costs
An additional contributing factor to these high costs is a lack of time performance standards. In a 2002 report published by the Transit Cooperative Research Program (TCRP) and sponsored by the FTA entitled “Maintenance Productivity Practices,” the TCRP described the benefits of instituting time performance standards in the repair and maintenance of bus transit vehicles at public transit agencies. The authors reported that they had interviewed MBTA maintenance administrators and concluded that “there are no restrictions in the union labor agreement on the use of repair times.” But the authors also reported that MBTA officials had told them that “if the T wanted to require that maintenance employees meet time standards, it would have to negotiate with the unions.”
Since publication of that report, no time standards for repairs have been instituted, according to MBTA maintenance officials with whom Pioneer Institute spoke in 2013. T officials told Pioneer Institute that the practical difficulty of instituting and enforcing time standards is due to opposition from the union-manned garages, which have dissuaded the agency from adopting the standards.
The MBTA Board of Directors, former-Secretary of Transportation Richard Davey, and the MBTA administration took advantage of cost-saving opportunities available through competitive procurement in rare instances when the Pacheco law had not prevented them from doing so because of insufficient in-house capacity to meet schedule demands. In December of 2012, they outsourced the full-scale “mid-life” reconstruction of 192 Neoplan diesel buses purchased by the MBTA in 2004/2005 to a Michigan bus refurbishing company following a competitive bidding process. The 192 Neoplan diesel buses constituted 22.5 percent of the buses the T used for maximum service, which was 850 in 2011 according to the NTD data.
The MBTA’s decision to outsource followed the recommendations of a transportation consulting company whose hiring had been approved by the MBTA Board of Directors. Saving money was on board members’ minds when they voted to outsource the bus overhauls. As meeting minutes illustrate, the board members expressed interest in outsourcing bus overhauls due to the promising savings the transportation consulting company estimated. The minutes also indicated that the board’s chair asked the MBTA’s chief procurement officer to compare the cost of contracting to the in-house alternative. She responded that it would cost 50 percent more to do the work in-house. The board then approved the contract.
Had the MBTA operated at the average cost per revenue hour of its peer agencies over that period, it would have saved $194.3 million dollars.
Recommendation 3: Undertake a stem-to-stern analysis of the MBTA’s central administrative functions, with an eye toward (1) ensuring the talent and experience needed to drive appropriate system and culture changes throughout the Authority, and (2) reducing topline administrative costs in order to redeploy them to direct services.
Potential savings: $3 million per year.
Currently, the administrative staff at the MBTA’s central office number almost 200 individuals. Their responsibilities include all-important functions from strategy and planning to oversight, accountability and public communication, finance and operational and capital project management.
- Strategy and planning are essential to the maintenance and operation of a dependable, high-performing transit system. Management must keep aware of technologies and best practices throughout the country to advance a vision of the MBTA’s future, while at the same time continually asking of today’s system – “what can go wrong that would prevent us from getting customers from point A to point B on a timely basis?” Management must anticipate potential variances from original plans and develop solutions and an implementation plan for problems before they occur.
- The administrative staff must rebuild the public trust that has eroded over the years and reached a nadir during last winter’s storms. It can only do that by providing the kind of communication that riders and the general public need in their daily lives. In addition it must make performance reports accessible and user friendly to interested members of the public, media, industry and state government.
- Capital projects require oversight by seasoned professionals that understand the system and can hold contractors accountable to the terms of well-drafted contracts. Management must have the bandwidth to give appropriate levels of oversight to achieve on-time and on-budget results.
This is not meant to be an exhaustive list nor to be overly critical of any one aspect of the MBTA’s administration. Rather, it is to say that with the fresh and focused eyes of the MBTA Finance and Management Control Board, it is a good time to review each position in the central office to ensure that the right people are in place that will drive operational and cultural changes within the entire organization. The review should include:
- An analysis of each administrative job position to determine how that position aligns with the short-term and long-term needs and goals of the MBTA. A determination should be made of each staff’s ability to meet the requirements of the position.
- Clarification of planning and decision-making roles, including the development of a clear organizational chart, a clear line of authority and a system of accountability to determine performance.
- An effort to reduce overall headcount as appropriate in order to meet the goals of the organization.
A focus on the central office is the appropriate starting point for a successful transformation of a beleaguered organization. For example, after his appointment as the receiver of the Lawrence Public School (LPS) system, Jeffrey Riley undertook a similar exercise, reducing the headcount in the LPS central office both to provide role clarity and to signal to the many hardworking teachers in the district that he was focused on their work, and that he would do everything necessary to ensure that they had adequate resources even if it meant slimming down his own staff.
The savings here are unknown until the analysis is done. That said, a back-of-the-envelope look at the costs associated with 200 managerial staff suggests that the MBTA is currently spending around $30 million dollars on its central office administration. A ten percent reduction would result in a $3 million savings. Given that this sort of exercise has not been undertaken in years, if ever, it is likely that efficiencies can be found that will enhance the operational performance of the T’s administration and allow for some additional funding to go to the T’s actual operation.

