Boston Children’s, MGH Among Massachusetts Hospitals with Highest Relative Commercial Prices
Some hospitals show variations in relative commercial price as high as 100 percent of average prices
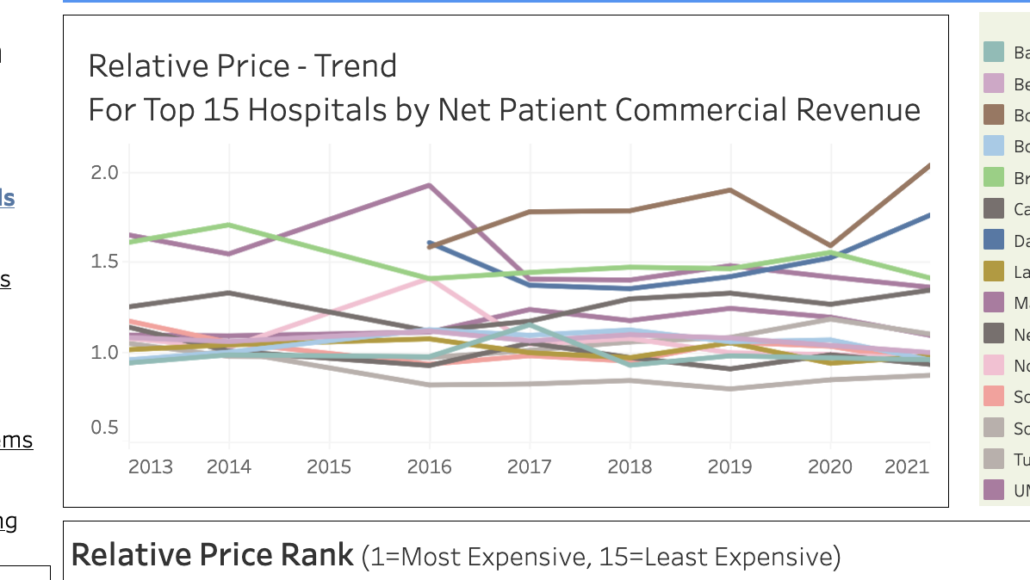
BOSTON – From 2017 to 2021, Boston Children’s Hospital had the highest commercial prices relative to any other Massachusetts hospital, according to a new interactive website, MA Hospital Relative Price Tracker, developed by Pioneer Institute.
Of the 15 hospitals with the highest commercial revenue, Children’s ranked first in relative commercial prices during those years. For 2015 and 2016, Massachusetts General Hospital (MGH) ranked first in commercial prices relative to other institutions.
“The Commonwealth has for many years had among the nation’s highest healthcare costs and prices,” said Pioneer Senior Fellow in Healthcare Barbara Anthony. “The data show that a few major Massachusetts hospitals have relative commercial prices that range from about 25 to 100 percent of average commercial prices.”
“Commercial revenue” is the negotiated amount paid to hospitals by health insurance companies and large employers. It does not include government payers. “Relative price” compares the average prices charged by a hospital to the average of prices charged by all hospitals.
Relative price data are available from 2013 until 2021. The hospitals with the highest relative prices for commercial healthcare were Children’s, Dana-Farber, Brigham and Women’s, and MGH. The lowest were in the Southcoast Hospitals Group: Charlton Memorial in Fall River, St. Luke’s in New Bedford, and Wareham’s Tobey Hospital.
The MA Hospital Relative Price Tracker displays relative price and facilitates relative price comparisons among hospitals.
Relative price data is collected and reported by the Commonwealth’s Center for Health Information and Analysis (CHIA) and is an aggregate measure used to evaluate price variations among different hospitals. It is recalculated annually based on data collected from commercial payers and includes information on private commercial insurance and commercially managed public insurance products such as Medicare Advantage and Medicaid Managed Organizations/Accountable Care Partnership Plans.
Relative price values take into account differences in patient condition, types of services delivered, and the different insurance product types payers offer to their members.
The average price among all hospitals will have a relative price of 1.0. A relative price of 1.5 means that a hospital charges 50 percent higher than the average of all Massachusetts hospitals. Similarly, a relative price of 0.84 means that a hospital’s prices are 16 percent below average.
“Efforts have been made to tame the rate of healthcare cost growth in Massachusetts, such as creating the Health Policy Commission, which sets a soft ceiling for spending,” said Pioneer Executive Director Jim Stergios. “But we continue to see large disparities in relative prices levels between some major institutions and the rest of the market.”
A hospital’s relative commercial price ranking has generally remained stable over time. In addition to an annual relative price ranking of all Massachusetts hospitals from 2013 to 2021, the MA Hospital Relative Price Tracker includes a subsection on all hospital systems in Massachusetts, the individual hospitals within each system, and the relative price levels of such hospitals. The tracker application includes both a graphical and chart format.
Relative price is not the same as the actual price charged by any particular hospital. The relative price metric cannot be used in connection with the actual price of any one particular service or bundle of services at any hospital.

