MBTAAnalysis: A look inside the MBTA
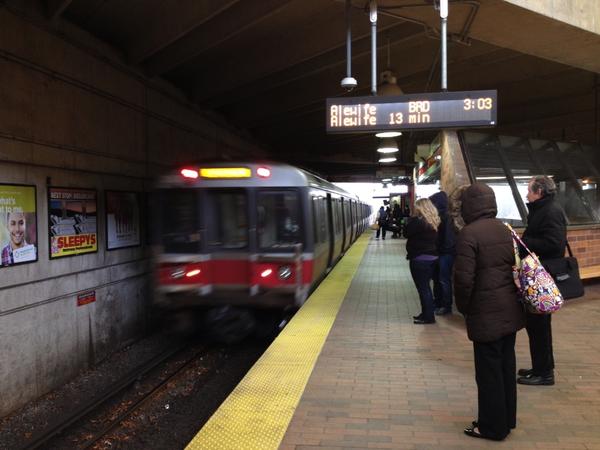
The MBTA shuttles over a million passengers a day around Greater Boston on buses, trains, trolleys, subways and ferries. The system is essential for commuters within core metropolitan communities, outer suburbs and even many Gateway Cities.
But the T has had a long history of troubling cost overruns, long delays, poor service, and at times rundown equipment and infrastructure. Massachusetts residents deserve a transit system that works effectively and efficiently, which can be achieved through transparency and good management. With Pioneer Institute’s MBTAAnalysis tool, everyone from citizens to policymakers can explore the inner financial workings of the MBTA and make sense of the data. Let’s take a look at a few insights about how the T runs.
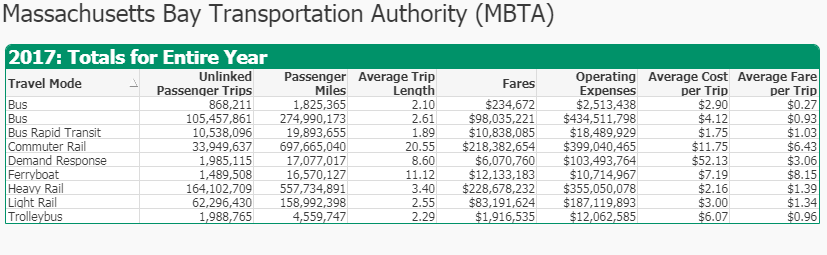
Thanks in part to mounting pressure to address cost effectiveness, the MBTA has made some improvements. For example, operating cost per vehicle hour has decreased from its 2010 high point. But the comparison with other major transit systems still raises concerns. The Chicago Transit Authority, which operates in a similar climate, moved 1.66 million people daily, compared to the MBTA’s 1.3 million, yet its 2017 operating expenses were $1.52 billion, lower than the MBTA’s $2 billion. All told, the MBTA had annual operating expenses of $434 million for its buses, just over $10 million for ferries and $941 million for all its rail services.
Data from 2017 indicate that relative to fares collected, most MBTA services are operating at a loss—although this is common across many other US transit systems. Commuter rail, for instance, generates $218.3 million in revenue from fares every year but costs $399 million to operate. Similarly, the $311.7 million from subways and trolleys falls far short of the $542 million actually needed to run them. By far, one of the most expensive categories is “demand response,” when the MBTA adds additional buses for peak traffic or line disruptions, which produced a mere $6 million in fares relative to a $103.4 million cost.
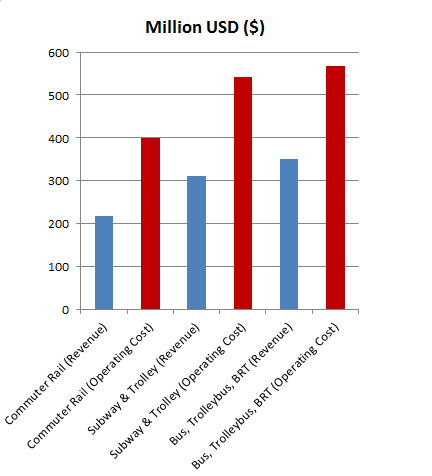
MBTA Revenue vs. Operating Cost
What makes up these expenses? In addition to $216 million for general administration and $154.6 million for other forms of maintenance, vehicle maintenance was the largest category. The MBTA is in the top tier nationwide for vehicle maintenance costs, due in part to aging equipment, many different kinds of vehicles and constant exposure to the elements. Buses cost the MBTA $96 million a year to maintain, plus a modest $1.6 million for the Silver Line. Commuter rail was the single most expensive category with $114 million, although at almost $117 million, the sum of all other rail service was higher.
Since it began operating in the 2000s, the Silver Line has connected many areas of the city not previously served by rapid transit. Although this bus rapid transit system is second only to New York’s in revenue, the $10 million it collects does not match its $18.4 million total operating costs. Trolley buses running in Watertown and Cambridge operate at a loss, generating only $1.9 million in fares and racking up $12 million in operating costs.
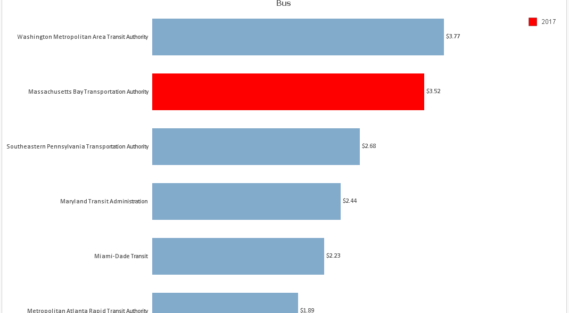
Total operating cost (USD) per passenger mile travelled of the MBTA and its peers
If not the Silver Line, is there a silver lining? Curiously, the one mode still financially afloat does so quite literally. The ferry system generated more money than it consumed, pulling in just over $12 million in fares, surpassing its $10 million operating costs and racking up only $455,738 for repairs in 2017—less even than the Casco Bay Lines in Portland, Maine.
When it comes to public transit and effort to achieve efficiency, there may never be a simple answer. But continuing to assess the data can point in the right direction.
About MBTAAnalysis
MBTAAnalysis.com is the leading tool for assessing the performance of the MBTA, launched by the Pioneer Institute in 2016. It offers comparisons with other public transit systems, large and small, throughout the United States as well as unique ways to make sense of data across categories as diverse as operating efficiencies, capital expenditures, operating expenses. With 25 years of data from 1992 to 2017, MBTAAnalysis gives users a comprehensive view in hopes of getting the Boston metro area’s transit system back on track.

