
MassAnalysis: Drawing data-based comparisons between cities and towns
Massachusetts has 351 cities and towns—a constellation of communities ranging from small towns like Gosnold to major metropolises like Boston. But drawing comparisons between communities and getting a sense of how different municipal governments stack up has traditionally been very difficult. With the MassAnalysis data tool, created by the Pioneer Institute, it’s possible to gain visibility and meaningful insights by setting peers for a given community across numerous metrics. Let’s take a look at Worcester, the “Heart of the Commonwealth” and its second-largest city, and see how it stacks up.
Revenue, Expenditures and Debt
Among its immediate peer group, which includes the 20 most populous cities in the state, Worcester collects total annual revenue of $3317 per capita, which comes in well below Boston’s $4427 or Springfield’s $4034.
The per capita breakdown for the city is $1591 from local taxes, $1550 from state aid and $152 from local fees or federal aid. Worcester draws less heavily on state aid than Lawrence or Springfield, whose per-capita revenue numbers each include over $2000 from the state.
In most categories of expenditure, like public works, police and education, Worcester is close to the median of its urban peers. During 2016, Worcester spent $2820 per capita, the bulk of which went to education costs. In fact, the city spends close to $260 million on schools out of a total budget of $520 million.
 Indicators for society
Keeping the public safe from violent and property crime is a key goal for every police force in the state. So how much does Worcester spend on public safety? The city stands just ahead of Lynn and New Bedford and modestly behind Springfield, which has 197 violent crimes per 100,000 people compared to Worcester’s 190. In fact, Springfield ranked ahead of Worcester across other categories, such as property crime. Looking at other cities in Worcester County, Fitchburg is similar to Worcester, with a rate of 188 violent crimes per 100,000.

From left to right: Total property crime occurrence, Property crime rate per 100K population, Total violent crime occurrence, Violent crime rate per 100K population
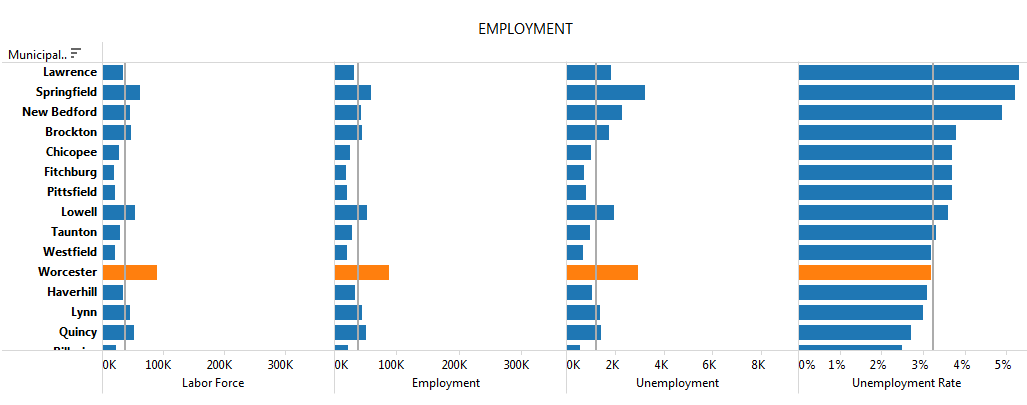
Although Worcester’s crime rate remains comparatively high among Massachusetts cities, residents can celebrate one bit of good news: Low unemployment. Thanks to a booming national economy, unemployment rates are low in most of the state, peaking at five percent in Lawrence, Brockton and New Bedford. At three percent, Worcester falls below the median unemployment rate of its peers. The city’s three percent unemployment rate is one that many Massachusetts communities haven’t enjoyed in decades.
Setting a peer group can align data and offer insights into the comparative performance and circumstances of various communities. This is especially important for citizens and policy makers committed to well-managed spending, avoiding unnecessary local debt and ensuring strong employment and public safety. For the “Heart of the Commonwealth,” such public policy “EKG readings” help the city chart its future course.
About MassAnalysis
MassAnalysis is a powerful tool for comparing Massachusetts municipalities across multiple categories to draw meaningful comparisons from diverse data. Citizens and policymakers can compare education, crime, financial strength, tax rates, revenues and expenditures to make sense of how communities are performing. Learn more at massanalysis.com.

