The MBTA’s Aging Infrastructure: Improvements have Failed to Materialize for the T
The Massachusetts Bay Transportation Authority (MBTA) has long been beset by numerous problems, including huge operating deficits and inefficient service. Improving operations, safety, and oversight have been major policy priorities for both current and previous governors. After years of reforms, how is the MBTA doing?
During the winter of 2015, the MBTA’s many problems became glaringly apparent as snow storms caused shutdown after shutdown. That year, MBTA operating expenses for buses, commuter rail, and light rail – such as the Green Line – reached respective highs (at the time) of $408 million, $405 million, and $184 million according to MBTA Analysis. In 2010, those same operating expenses were $338 million, $280 million, and $141 million, respectively. According to the MBTA Fiscal and Management Control Board, the large growth in operating expenses contributed to MBTA expenditures (excluding debt service) topping $1.5 billion in 2015, far outpacing revenue and prompting calls for reform.
Since then, there has been improvement in some areas. MBTA revenue growth beat inflation, reaching $777 million in 2019, up from $661 million in 2015 . During this same period total operating expenses remained relatively consistent, growing from $2.06 billion in 2015 to $2.25 billion in 2019, with operating expenses for commuter rail actually dropping from $405 million in 2015 to $384 million in 2019, according to MBTA Analysis. This progress was derailed by the Covid-19 pandemic, as revenue shrunk to $453 million and operating expenses grew to $2.35 billion in 2023.
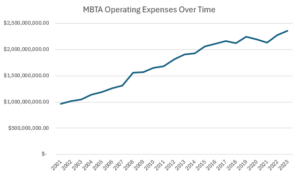
Figure 1: Graph of total MBTA operating expenses compiled from MBTA financial statements
Unfortunately, MBTA ridership failed to increase even before the pandemic, as total vehicle revenue miles only increased from 99 million to 101 million between 2015 and 2019, according to MBTA analysis. Total passenger miles traveled during that time also decreased, falling from 1.8 billion in 2015 to 1.7 billion in 2019. However, both these changes mirror ridership changes in other metropolitan areas during that time. Alas, the MBTA lost significant ridership during the Covid-19 pandemic with only 483 million passenger miles traveled in 2021.
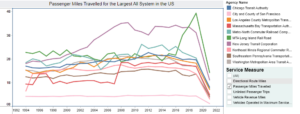
Figure 2: MBTA analysis 2021
The ridership challenge would be inconsequential if not for other factors that cost the MBTA millions every year, such as failure to collect fares, servicing its significant debt, and an increasing backlog of repairs. This backlog grew from $7.3 billion in 2015 to $10.1 billion in 2019 to $24.5 billion in 2023. Other public transportation systems also have large backlogs, such as New York City’s Metropolitan Transportation Authority’s repair backlog of $46 billion and Chicago’s $19 billion backlog. However, when you consider the New York City Metropolitan Area’s population of 23.5 million, the Chicago metropolitan area’s population of 9.4 million, and Greater Boston’s population of 4.9 million, the MBTA’s repair backlog is enormous. This large backlog of needed repairs affects 64 percent of the MBTA’s assets and contributes to the MBTA’s numerous problems, including delays and shutdowns.
About the Author: Raif Boit is a Roger Perry Transparency Intern at Pioneer Institute for the summer of 2024. He is a rising freshman at Harvard College.

