School Expenditures in the 2019 and 2020 School Years
The Massachusetts K-12 school system has been regarded as the most highly ranked system by the US News & World Report for years. According to Pioneer Institute’s MassReportCards tool, the ways in which Massachusetts schools spend money has been changing in the past few school years.
The overall spending in Massachusetts school districts has slightly increased from 2019 to 2020 (Note: the 2019 school year represents the school year from July 1, 2018-June 30, 2019, and the 2020 school year represents the school year from July 1, 2019-June 30, 2020). In 2019, districts spent a total of $16,884,101,109 on school expenses, while in 2020, spending amounted to $16,929,248,719, an increase of about 0.26%. (Note: the rate of this increase in expenditure is slower than the rate of inflation in the United States). More broadly, overall spending has been gradually increasing yearly since 2016.
A deeper look shows that expenditure on all transportation decreased from the 2019 to 2020 school year. In 2019, Massachusetts schools spent $639,039,804 on transportation services. In the 2020 school year, this spending dropped down to $576,645,732, representing a decrease of about 10%. This trend can also be observed in the subcategories of transportation services. For example, out-of-district transportation spending decreased from 2019 to 2020. In 2019, Massachusetts school districts spent $158,270,338 on out-of-district transportation (Figure 1). In 2020, this dropped by nearly 7% to $147,431,302. Overall, this drop could be due to the impact of remote learning in the last three months of the school year due to the COVID-19 pandemic.
In 2019, the districts spent $434,541,650 on instructional materials, equipment, and technology, and this increased by nearly 3% to $446,998,854 in the 2020 school year. Spending on guidance counseling also increased from 2019 to 2020. In 2019, the school districts spent $484,679,040 on this service. In 2020, this spending increased by about 3% to $499,148,166. The effects of the pandemic in the months of March through June of the 2020 school year may have contributed to the increased spending on guidance counseling, since mental health issues generally increased during the pandemic.
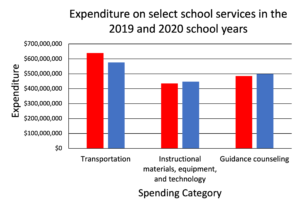
Figure 1. School expenditure on transportation, instructional materials, and guidance counseling between the 2019 and 2020 school years.
Spending on teachers also increased from 2019 to 2020. In 2019, the school districts spent $5,801,163,619 on teachers. In 2020, they spent $5,891,692,295 on teachers, representing an increase of approximately 1.6%. Massachusetts teachers have some of the highest teacher salaries in the country. In the 2018-19 school year, the average teacher salary in Massachusetts was $82,349, representing an increase from the average salary in years prior. For example, in the 2017-18 school year, the average teacher salary was only $80,204. While data on average teacher salaries in Massachusetts in 2020 is not yet available, it will be interesting to see how the average teacher salary in Massachusetts may have changed over these two school years.
Overall, statewide per pupil spending has also been increasing over the years. From the 2016 to 2020 school year, per pupil spending has increased from $15,491 to $17,576, representing an increase of approximately 13.50%. This per pupil spending differs by school district and type. As of 2020, Provincetown, Minuteman Regional Vocational Technical, Cambridge, Truro, and Wellfleet had the highest rates of per pupil expenditures, respectively.
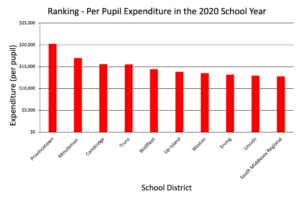
Figure 2. The districts with the ten highest per pupil expenditure in the 2020 school year.
Provincetown had the highest average per pupil expenditure, with an average $20,269, and at Minuteman Regional Vocational Technical it was $16,985 (Figure 2). Cambridge had an average per pupil expenditure of $15,573 in that year. Of the districts representing Cape Cod, Truro had an average per pupil expenditure of $15,521, and Wellfleet had an average expenditure of $14,419. When the data for the 2021 school year becomes available, it will be valuable to have this knowledge to understand how spending patterns may have changed in response to the COVID-19 pandemic.
About the Author: Emily Donovan is a Roger Perry Government Transparency Intern at Pioneer Institute for the summer of 2021. She is a rising senior studying Animal Behavior at Bucknell University.

