
A Bird’s Eye View: Massachusetts K-12 Education by County
For decades, Massachusetts has been one of the highest-rated states for public education. The state still maintains the best public schools system in the country, a position held ever since the early nineties. The state has the sixth highest spending on education in the nation: at $17,058 per student in 2023.
Does the high performance of Bay State schools translate ratably among its 13 counties, or is statewide performance carried by a handful of strong regions? An inter-county comparison of performance and expenditures can highlight areas that are excelling and those that are falling behind.
Expenditures Remain Consistent
While there tends to be significant district level differences in per-pupil expenditures, county wide figures are generally consistent throughout the state . Figure 1 shows the per pupil spending of each county, with the median at $20,434. The data slopes down considerably among the highest-paying counties, evening out near the middle, then continuing down again to the end.
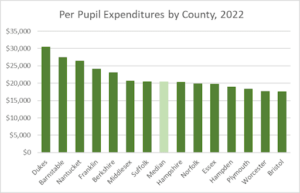
Figure 1: Per pupil expenditures by county, arranged from highest to lowest. The median is in light green. Data was collected from Pioneer’s MassReportCards website.
Western counties are spread evenly throughout the data, with two above and below the median. This comes as a surprise, since western counties generally tend to group closely with one another. The lowest spending county was Bristol, one of only two counties spending less than $18,000 per pupil.
Mass Holds Strong with Graduation Rates…
Graduation rates are one of the best measures for determining a school system’s efficacy. Figure 2 shows that the median graduation rate in Massachusetts is 91.9 percent – over six percentage points higher than the national average in 2021 of 85.3 percent.
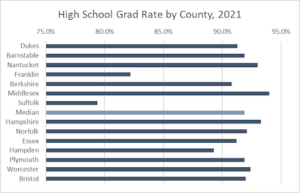
Figure 2: High school graduation rates by county, arranged from highest spending to lowest. The county median is in light blue. Data is from Pioneer’s MassReportCards website.
Nearly all the counties orbit around the median, with few deviating more than three percent. The notable exceptions are Franklin and Suffolk counties, with graduation rates at 82.2 and 79.3 percent – the only counties to rank below the national average.
There’s not a whole lot of correlation between spending and education outcomes.. For example, Worcester has a graduation rate higher than the median – 92.4 percent – yet spends the second least per pupil, at $17,727. In contrast, Franklin has the second-lowest graduation rate of 82.2 percent, while having the fourth highest per-pupil expenditure of $24,184. While this may have a correlation among other states, the data shows the pattern isn’t present among counties.
…yet Falters With MCAS Scores
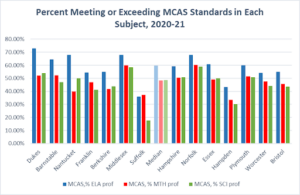
Figure 3: Percentage of students meeting or exceeding the standard in each MCAS subject, arranged from highest spending to lowest. The median is in the lighter shades. Data is from Pioneer’s MassReportCard website.
While controversial, MCAS scores are a reliable indicator of a school system’s quality and achievement. The results for each county have a larger distribution around the median than previous metrics: while some counties are near-identical to the median, like Essex or Plymouth, most deviate from the median by at least 5 percent.
Much like before, there does not seem to be an evident correlation between MCAS proficiencies and expenditures. It is true that the bottom three spenders have proficiencies in ELA about ten percent lower than the top three spenders: yet this discrepancy isn’t seen with math or science. Middle of the pack spenders, like Middlesex and Hampshire, generally have the best rates in the state. Suffolk remains as the lowest performer in this category as well, with a 30.7 percent difference between the county’s science proficiency and the median.
Key Takeaways
Generally, Massachusetts’ counties tend to perform similarly in spite of expenditure differences. A western county like Hampshire performs on par or better with an eastern county, like Middlesex. The only true exception to this is Suffolk, which underperforms by a significant margin.
However, counties do not tell the full story. Spending and performance between districts can vary considerably – even in the same county. While inter-county comparisons can provide a bird’s-eye view of the problems at hand, going a level deeper and looking at the district might produce clearer results.
Peter Mentekidis is a Roger Perry Transparency Intern with the Pioneer Institute. He is a rising senior at Providence College, with a major in Quantitative Economics and a minor in Philosophy. Feel free to contact via email, LinkedIn, or writing a letter to Pioneer’s office.

