Urban Cyclist Fatalities: Improving the Safety of Our Commuters
As more commuters and active Americans are taking to the streets – by bicycle – local governments and cyclist action groups have been working together to enhance safety measures to combat motor vehicle-cyclist accidents. In 2018, Massachusetts experienced four bicycle fatalities after 12 the previous year.
The issue with sharing the road is that bikes are unpredictable. When riding through intersections or on roads without protected lanes, Boston’s Bike Laws require riders to “follow all traffic laws and regulations, including stopping at stop signs and following all traffic lights” just as a car would. What establishes a lack of trust in the city are options like being able to pass on the right and hop on and off the sidewalks “when necessary in the interest of safety,” meaning bicycles will not always behave like their motor vehicle counterparts.
Pioneer set out to compare fatality data, miles of bike lanes, and cyclist commuter statistics in the five largest cities in the Northeast to develop recommendations for what urban areas can do to improve dangerous riding conditions. Boston is a nationwide leader in bicycle data collection, outlining its goals to encourage sustainable and affordable transportation for the general and working population while getting ahead of other cities in climate resilience goals. Keeping these universal aims in mind, the data also serves to inform safety changes for the existing bicycle network as well as the best strategies of expansion. Figure 1 breaks down population, miles of bike lanes and ratio of miles of bike lanes per 100,000, number of cyclist fatalities and the ratio of fatalities per 100,000, and the ratio of fatalities per 100 miles of bike lanes in New York, Philadelphia, DC, Boston, and Baltimore.
Figure 1: Northeast’s Bike Lane and Fatality Statistics (2019 Est.)

Sources: US Census Population 2019 Estimates, League of American Bicyclists “Biking & Walking Road Safety”, NYC DOT “Cycling in the City”, Billy Penn “Bike Lanes 101”, DC DOT “Bicycle Lanes”, Boston Herald “68 Miles of Bike Lanes with More to Come”.
New York is by far the largest of the cities and had the highest count of cyclist fatalities with 24 in 2019, according to League of American Bicyclists data. Philadelphia had two while DC and Boston had one. However, the most disproportionate fatality ratio to population was in Baltimore, where two deaths occurred in 2019 across nearly 600,000 residents, making the .34 fatalities per 100,000 higher than New York City’s .29.
The US Census published the results of an American Community Survey providing 2019 estimates for commuting characteristics by city. Next, Pioneer analyzed those results with cyclist fatality counts to calculate fatality ratios per 10,000 cyclist commuters.
Figure 2: Northeast’s Cyclist Commuter Statistics (2019 Est.)

Sources: US Census American Community Survey “Commuting Characteristics by Sex” (2015) 2019 Estimates and League of American Bicyclists “Biking & Walking Road Safety”.
Bike League’s data also demonstrates safety in numbers by introducing a nationwide trend: cities with higher rates of biking to work demonstrate lower rider fatality rates per 10,000 cyclist commuters. To visualize the statistics from Figure 2, this bar graph indicates a negative correlation between the percentage of cyclist commuters per city and the fatality rate per 10,000.
Figure 3: Northeast’s Cyclist Commuter Percentage to Fatality Ratio Comparison (2019 Est.)

Sources: US Census American Community Survey “Commuting Characteristics by Sex” (2015) 2019 Estimates and League of American Bicyclists “Biking & Walking Road Safety”.
Across the Northeast, it appears that cities that have grown accustomed to cyclist commuters have lower rates of fatalities, drawing back to the issue of motor vehicle-bicycle relationships. Outside of sharing the road and being more aware of prospective riders, especially during commuting hours, the most common solution to combat cyclist fatalities has been to create protected and separate bike lanes.
In DC, the current 16.6 miles of protected bike lanes will be joined by another 20 miles by 2023 in a new DOT initiative providing more transportation options meeting safety and sustainability goals. While urban areas struggle with aggressive drivers, traffic congestion, and narrow streets, the District remains a leading example of how protected bike lane plans provide safer and alternate routes for the rising population of biking commuters.
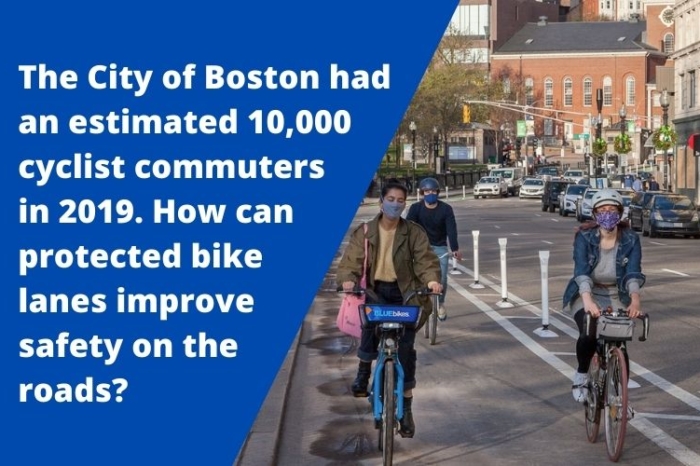
What does all of this mean for Boston? The city currently uses a variety of bike lanes, from buffered lanes with a space in between cars and riders, parking-protected between parked cars and the curb, separated with flex posts, and a mix of one-way and two-ways. Already normalizing cyclist commuters, DOT should continue with its plans to increase the amount of bike lane miles per capita, specifically with sustainable and safe protected lanes.
For more information about Boston’s Better Bike Lanes initiative, area-specific projects, and design plans for both separated bike lanes and traffic-reduced areas, please visit https://www.boston.gov/departments/boston-bikes/better-bike-lanes.
Jack Landsiedel is a Roger Perry Government Transparency Intern at the Pioneer Institute for Summer 2021. He is a rising junior at the University of Maryland, College Park with a major in Government & Politics and minors in Public Leadership and Sustainability Studies.


