MassAnalysis: The scoop on Massachusetts municipal crime data
Preventing crime is a key concern for communities across Massachusetts. But how do different municipalities stack up in the fight against violent and property crime? With the help of the Pioneer Institute’s MassAnalysis tool, we’ll take a look at up-to-the-minute data that gives a sense of crime across the Commonwealth.
Violent crime
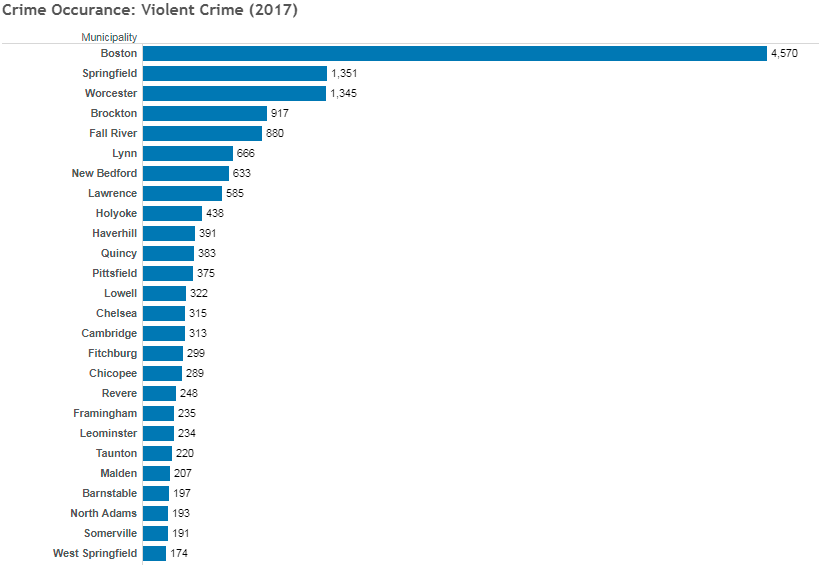
By the raw 2017 numbers, Boston registered the largest number of violent crimes in the state, with a total of with 4,570. This is no surprise, given that it is by far the Commonwealth’s most populous city. However, the pattern for violent crime doesn’t mirror population after that point. In 2017, Springfield and Worcester were nearly tied for violent crimes, with 1,351 and 1,345 respectively. Brockton stood in fourth place with 917. Other communities in the top 10 for Massachusetts included Fall River, Lynn, New Bedford, Lawrence, Holyoke and Haverhill.
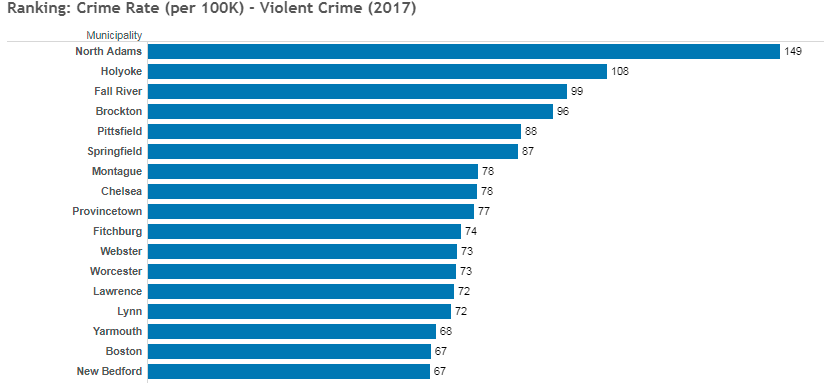
By contrast, the actual rate of violent crimes per 100,000 people tells a different story. North Adams had an alarming 149, significantly higher than the next community, Holyoke, with 108, and outranking Springfield and Worcester. Curiously, two other Western Massachusetts communities made the top 10: Pittsfield and Montague. Boston did not make the top 10 for rate of violent crime.
Drilling deeper into the data, murder and non-negligent manslaughter data indicate that Boston had 57 murders in 2017. Springfield was next with 14, followed by Lynn and Lawrence. Throughout 2017, some fairly large cities such as Framingham did not register a single murder, while others had a small number, such as the two committed in Cambridge.
Property crime
Motor vehicle theft has become much less common nationwide as a result of increasingly sophisticated electronics and computerization, as well as anti-theft systems that make it difficult for prospective thieves to even start a vehicle. In 2017, 1205 cars vehicles were reported stolen in Boston. Springfield and Worcester were next with 509 and 397 vehicle thefts, respectively.
Aggregate numbers aside, where in the Commonwealth are you most likely to have your car stolen? MassAnalysis data indicates that the two cities with the highest vehicle theft rates were Lawrence and Brockton, with 50 and 40 per 100,000 people.
Overall property crime rates indicate unusually high risk in several Western Massachusetts communities, including Holyoke and West Springfield. But some unusual data stand out from Cape Cod, where Provincetown had the second highest rate of property crime in the state.
Among felony property crimes, arson is sometimes overlooked. Arson disproportionately affects some Massachusetts Gateway Cities, which tend to have lower overall property values or many abandoned buildings as a result of deindustrialization and local economic challenges. New Bedford and Springfield each had over 30 reported cases of arson in 2017, trailed closely by Fall River with 29. Less than 10 incidents of arson were recorded in Worcester, Lynn and every other Gateway City except Brockton, which recorded 16.
The big picture
Massachusetts is one of the safest states in the US. Crime is universal, but certain parts of the Commonwealth are “hot spots” for different violent and property crimes. In 2008, across all categories, Holyoke had some of the largest number of crimes reported at 14,138, followed closely by Lynn, Chelsea, North Adams and Fall River. Fortunately, by 2017, the number of reported crimes fell to 4,777 bringing it more in-line with other cities its size.
Fighting crime is the responsibility of every community, but Massachusetts crime hotspots need to continually redouble their efforts and leverage data to help make sense of problems and keep residents safe. Falling crime rates can be driven down further through innovative enforcement in the years to come.
About MassAnalysis
MassAnalysis is a powerful tool for comparing Massachusetts municipalities across multiple categories to draw meaningful comparisons from diverse data. Citizens and policymakers can compare education, crime, financial strength, tax rates, revenues and expenditures to make sense of how communities are performing. Learn more at massanalysis.com.

