Massachusetts Residents Are Opting to File for Residential Energy Tax Credits
In 2018, 14,230 Massachusetts taxpayers received a total of $65,868,000 in green energy tax credits on their federal returns, but how can more take advantage of this offer? Pioneer set out to compare data on Residential Energy Credits (RECs) between Massachusetts and its New England neighbors using Pioneer’s Massachusetts IRS Data Discovery site.
RECs are a non-refundable credit recently extended by the Bipartisan Budget Act of 2018 that reimburses taxpayers up to 26% for costs on new builds or home renovations for tax years 2020 to 2022. This is less than the 30% rate for 2012-2019, according to previous versions of IRS Form 5695, and the rate will fall again to 22% in 2023.
Part I of REC, the Residential Energy Efficient Property Credit, is calculated in IRS Form 5695 by taking the allowable percentage of costs for solar electricity, solar water heating, small wind energy, geothermal heat pumps, and fuel cells with qualifying specifications. Part II of REC is the Nonbusiness Energy Property Credit (NEPC) specific to the filer’s primary U.S. residence, crediting certain home improvement costs including insulation materials and systems, metal and asphalt roofs, and external windows and skylights that meet energy efficiency requirements.
REC returns across New England are trending downward, Figure 1 comparing the number of energy credit returns per 1,000 total returns in each state by year:
Figure 1: Number of REC Returns per 1,000 State Returns Across New England (2012-2018)
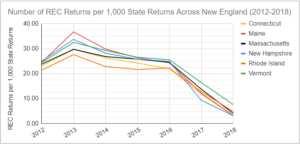
Source: Mass IRS Data Discovery (2012-2018)
Between all years listed in Pioneer’s Massachusetts IRS Data Discovery tool, peak participation rates were reached in 2013, the highest point of 36.74 taxpayers per 1,000 in Maine. The all-time low REC return rate was experienced by New Hampshire in 2018 at 3.15, with an all-state 2012-2018 mean 21.24 REC returns per 1,000 – or about 2%. Massachusetts has taken its place in the middle of the pack, placing third among the six New England states over this period and with a low of 4.12 in 2018.
Despite Vermont and Maine’s lead in the number of REC filers, Massachusetts was number one for average REC amount for 2018 at $4,630, followed closely by Vermont and at over 1.5 times higher than Maine:
Figure 2: Average Residential Energy Credits in New England (2018)
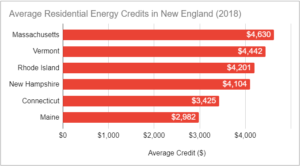
Source: Mass IRS Data Discovery (2018)
Below, Figure 3 creates an REC breakdown by income range, comparing the number of returns filed, the total amount in credits received by tax filers, and the average credit amount:
Figure 3: Massachusetts Residential Energy Credit Statistics by Income Range (2018)
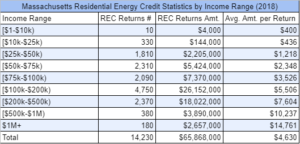
Source: Mass IRS Data Discovery (2018)
Pioneer’s IRS data indicates that the average credit per return consistently increases as income rises. One interesting trend is in an apex AGI range of $100,000-$199,999, where the amount of REC returns and total dollar amount of credits tops off. In fact, Massachusetts filers in that range accounted for 39.7% of the total credit amount from the IRS despite only making up 17.0% of returns in 2018. Those making $500,000 and above make up just 1.8% of all filers, but are raking in more than five times that percentage – 9.9% – of the total amount of REC returns. Figure 4 helps to explain this income anomaly:
Figure 4: Massachusetts Residential Energy Credit Number of Returns per 1,000 Total Returns by Income Range (2018)
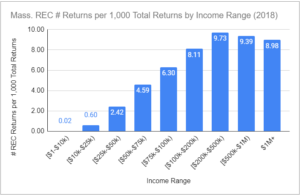
Source: Mass IRS Data Discovery (2018)
The above bar chart illustrates the number of REC returns per 1,000 total Massachusetts filers per income bracket, suggesting that filers with higher AGIs use Residential Energy Credits more often than do those in lower income brackets. In fact, nearly one in one hundred of those making $200,000-$499,999 filed Form 5695 in 2018 alone. It’s only half as many for filers with an income of $50,000-$74,999 and one quarter of the amount for residents in the $25,000-$49,999 bracket.
Future IRS data will detail how decreasing REC rates will impact the number of residents filing, although the 2016-2018 drop in Figure 1 occurred at the same 30% rate held from 2012 to 2015. In addition, new policy initiatives could help encourage or incentivize lower income residents to participate in household green energy, whether it addresses filers in rented versus owned residences, or levels of solar affordability.
Jack Landsiedel is a Roger Perry Government Transparency Intern at the Pioneer Institute for Summer 2021. He is a rising junior at the University of Maryland, College Park with a major in Government & Politics and minors in Public Leadership and Sustainability Studies.

