
Charitable Contributions in New England: Trends by Income and State
American culture embraces and encourages charity. As such, the positive trend of increasing donation size as incomes rise is to be expected. However, income is not the only determinant of donation size, with psychology, personal interests, and geography influencing how much people donate and subsequently report as charitable contributions.
Information from Pioneer Institute’s IRS Data Discovery Database revealed many interesting trends for charitable giving in New England states.
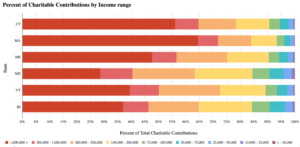 MA, NH, and CT residents who earn at least $1 million annually account for between 50% – 65% of their respective states’ total charitable contributions. In contrast, those in VT, RI and ME who earn over $1 million annually make up about 30% of total charitable contributions in their states.
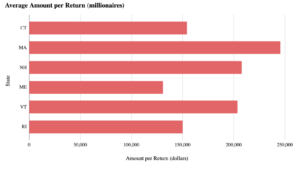
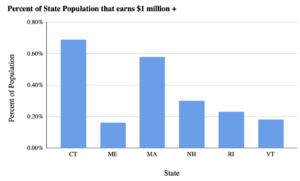
Interestingly, contributions from millionaires in VT, NH and MA average over $200k per donation, whereas CT, RI and ME millionaires contribute around $50k less per donation. CT millionaires make up a higher proportion of the state’s taxpayers (0.69%) than those in VT (0.18%), so even though they contribute less per return on average, they still manage to contribute 56.1% of all their state’s returns.
In addition, those who make between $25k and $100k in CT, MA, and VT claim roughly the same amount per return. In CT the average donation sizes range from $2.7k to $3k per return, and the amount contributed per return jumps to $4.8k for those who make between $100k and $200k. Those who make between $25k and $100k contribute between $2.6k and $2.9k per return in MA and $3.2k to $3.7k in VT. As in CT, the amount per return increases by over $1000 for those who make between $100k and $200k.
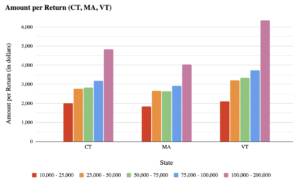
By contrast, the average contribution size per return across income brackets in NH and ME appears more like a consistent step function, with each income bracket contributing slightly more than the one below it.
According to the Pew Research Center, three-person U.S. households that made less than $40,100 in 2018 were considered ‘low income’. Those earning between $40,100 and $120,400 were considered ‘middle class’, and anyone making over $120,400 a year was considered ‘upper class.’ Given these income classifications, it is interesting that those making $25-$50k a year contribute almost the same amount as those who make $75-$100k, since the majority of the first income range is considered ‘low income’ and the second ‘middle income.’ However, it is noteworthy that the Tax Cuts and Jobs Act raised the standard deduction, potentially incentivizing those with lower incomes not to itemize their deductions, which are likely lower than the standard deduction. This means the amount of charitable contributions might be higher than what is reported in IRS data.
This disparity begs a closer look into why people donate to charity. An article from The Conversation suggests a variety of psychological reasons why people donate, including regularly-cited explanations like altruism, egoism, and the chance to claim higher tax deductions. However, there are more reasons that are not fully obvious nor regularly discussed, including social pressures and visible impact. When one knows the beneficiary of a donation and can see the benefits of their donation, they are more likely to donate. For example, if someone in your neighborhood creates a ‘Go Fund Me’ page to help with her sick child’s medical treatment, you may be more likely to donate because you know the family and know the donation is for a good cause.
Demographics and geography may play a role as well, according to an interesting study cited in the Philanthropy Round Table’s article “Who Gives”:
“Interestingly, when rich people live in separate enclaves they are not as generous as when they live interspersed in normal communities. The “How America Gives” study showed that when households earning $200,000 a year make up more than 40 percent of the residents of a particular ZIP code, they give just 2.8 percent of their discretionary income to charity. If they live in more mixed neighborhoods and towns, though, they give an average of closer to 5 percent.”
However, there are always those who will attempt to exploit the system by reporting more charitable contributions than they actually donated to receive additional tax deductions or hide charity fraud. In spring 2021 this happened twice in San Diego, CA and once in Frenchville, PA. There are no statistics readily available to otherwise quantify the frequency of this type of fraud, but it would be interesting to compare the distribution of misreported charitable contributions between income brackets and states.
Unsurprisingly, donations tend to rise with income in every New England state, but the level of donations from high-income individuals varies between states. The highest earners from MA, NH, and CT account for 50% – 65% of their state’s total charitable contributions (with Massachusetts leading the pack), but those in VT, RI and ME account for about 30% of their respective state’s total charitable contributions. Donation amounts are heavily based on individual levels of altruism, egoism, and trust in local organizations, but also depend on each donor’s personal priorities and areas of interest. Since such factors as altruism and personal interest are very hard to quantify, it may ultimately be impossible to determine just how much each factor contributes to the final donation decision.
Isabel Wagner is a Government Transparency Intern at the Pioneer Institute. She is currently studying Political Science and Economics at Boston College.

