
Part I: It May Be Better to Be Unemployed in Massachusetts than in Connecticut or New Hampshire
Connecticut, Massachusetts, and New Hampshire all rank among the 10 wealthiest states in the country. Massachusetts is third – behind Maryland and New Jersey – with a median household income of $96,505. New Hampshire has a median household income of $90,845, making it the sixth wealthiest state, while Connecticut is the eighth with a median household income of $90,213. It is clear that the populations of these states have high incomes compared to the rest of the country, but which is most desirable to live in if you find yourself unemployed?
Historical and Current Unemployment Trends
First, it’s important to understand where the unemployment rates of these states fall in relation to the national rate. Using Pioneer Institute’s LaborAnalytics, the figures below demonstrate what the unemployment rates over the last five decades have been for these three states. Connecticut has historically trended higher than Massachusetts and New Hampshire.
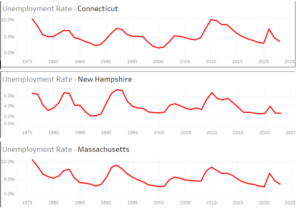
Figure 1: Labor Analytics
According to the Bureau of Labor Statistics, nationwide, the unemployment rate was 3.9 percent in April of 2024. Massachusetts’ rate was 2.9 percent the same month. New Hampshire, at 2.6 percent, had the lowest rate of the three states. Connecticut’s rate stood the highest at 4.4 percent.
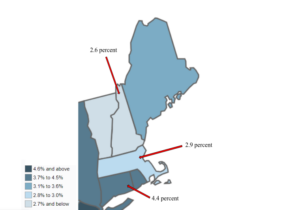 Figure 2: U.S. Bureau of Labor Statistics (April 2024)
The Differences Across the States in WBAs
Although these states have a lot in common in terms of location, they do not calculate unemployment benefits the same way. Massachusetts and Connecticut pay claimants roughly half of their average weekly wage when they were employed. They calculate using claimants’ two highest wage quarters of the previous four. They take the sum of the two selected quarters and divide by twenty-six to calculate a claimant’s average weekly wage. They then divide that average weekly wage in half – that number is the weekly benefit amount (WBA) for the claimant. New Hampshire uses a table system, and based on a claimant’s income, there is an associated weekly benefit amount that they are entitled to. The WBA’s in New Hampshire are roughly 1.0 to 1.1 percent of your annual income. Claimants in all three states with the same income are going to have similar weekly benefit amounts up to a certain amount.
The most important thing that distinguishes these three New England states from one another is the maximum weekly benefits claimants are entitled to receive. New Hampshire’s annual weekly payments are capped at $427. Connecticut has a higher maximum weekly benefit amount of $721. Massachusetts has, by far, the highest allowance for weekly benefits out of the three states at $1033. For individuals who don’t have a large income, they will receive the same in all states. However, as a claimants income gets higher, their benefits are going to be capped – first in New Hampshire, then in Connecticut, and lastly in Massachusetts.
The number of weeks a claimant can receive benefits also differs among the states. Connecticut and New Hampshire allow payments for 26 weeks in a 52 week period while Massachusetts offers 30.
While the cost of living may differ, Massachusetts offers more security to the unemployed than in neighboring Connecticut and New Hampshire. But what does that mean for employers? Stay tuned for Part II.
Dana DiChiro is a Roger Perry Government Transparency Intern at the Pioneer Institute for Summer 2024. She is a rising senior studying Government & Politics and Economics at the University of Maryland, College Park.

