COVID-19 Transparency – A Step Backwards
Since March 2020, the Commonwealth’s COVID-19 reporting has become more transparent and detailed — but recently the state took a step backwards which it ought to correct.
When the crisis began, the state did not readily embrace transparency with respect to relevant data. Only after public pressure did the Department of Public Health (DPH) begin reporting (a) cases by town instead of just by county; (b) the number of cases in nursing homes (and then did so only in numerical ranges, rather than precise numbers); and (c) the critical issue of deaths by nursing home.
With such data now being reported (along with extensive other data), the state has unfortunately taken the backwards step of ending its longstanding daily reporting of something basic and important: the virus’s cumulative impact on various age groups. The state has begun reporting age-group data only weekly, and solely based on data from the last two weeks, not cumulative data from the beginning of the crisis. Therefore, if a member of the public wishes to know something as fundamental as — for example — the overall rate of hospitalizations or deaths for a particular age group, a calculator (and magnifying glass) are necessary.
[T]he state has unfortunately taken the backwards step of ending its longstanding daily reporting of something basic and important: the virus’s cumulative impact on various age groups.
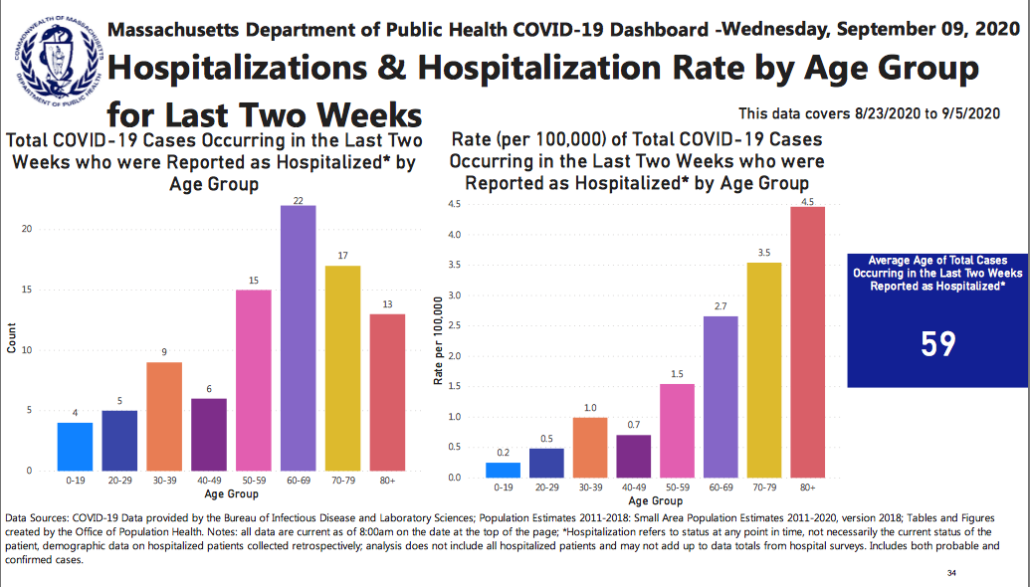
More specifically, from April 20 until August 11, the state’s daily report included three pages about COVID-19’s overall impact — i.e., since the start of the pandemic — on each of eight age groups. The first of those pages showed, for each age group, the total number of COVID-19 cases, and the number of cases per 100,000. The second and third pages did the same for total hospitalizations, and for total deaths.
Each page also showed a related average. For example the August 11 daily report showed that the average age of total COVID-19 cases was 50; the average age of total hospitalizations was 68; and the average age of death was 82. See pages 14-16 of the August 11 daily report here: https://www.mass.gov/doc/covid-19-dashboard-august-11-2020/download.
As is reflected in the Boston Globe’s daily Coronavirus data update,[1] starting on August 12 these three pages were removed from the daily report. The August 12 report, and subsequent daily reports, are here: https://www.mass.gov/info-details/archive-of-covid-19-cases-in-massachusetts.
The state is now reporting the virus’s impact on age groups using data for the last two weeks only, and presenting that information in a different report — the “weekly” report.
In the weekly report, the relevant section continues to report the same basic topics, but with sharply limited data. For example, the header “Average Age of Total Cases Reported as Hospitalized,” now reads (emphasis added) “Average Age of Total Cases Occurring in the Last Two Weeks Reported as Hospitalized.” (See, e.g., page 34 — and also 32 and 35 — of the September 16 weekly report here: https://www.mass.gov/doc/weekly-covid-19-public-health-report-september-16-2020/download.)
Yet the daily report continues to present data about the virus’s cumulative impact on dimensions other than age. The September 9 daily report, for example, shows cumulative information on dimensions including county, gender, pre-existing condition, and race/ethnicity. For instance, page 13 of that recent daily report shows, in part, “Cumulative confirmed cases to date” and “Cumulative confirmed and probable deaths to date” for each Massachusetts county. (See page 13 – and also 14 and 15 — of the September 9 daily report, at https://www.mass.gov/doc/covid-19-dashboard-september-9-2020/download.) (emphasis added.)
Certainly, reporting recent time periods may highlight emerging trends that would be less evident with reports based solely on cumulative data. But the state did not need to choose one type of report or the other. The state could obviously do both: present the virus’s cumulative impact by age group as well as a more recent snapshot. Reporting the latter alone is unnecessary and problematic.
For example, key age-related figures for the last two weeks do vary from the most recent available cumulative figures (those in the August 11 daily report). The average age of new cases is lower over the last two weeks than over the entire crisis: 36[2] vs. 50[3]. The same is true of the average age of hospitalizations: 60[4] v. 68[5]. The same is also true of the average age of death: 79[6] vs. 82.[7]
Concern about these recent developments is appropriate, but switching to two-week snapshots is a poor reflection of that concern. That method of reporting deprives citizens of up-to-date, easily-accessible data about the state’s full experience with COVID-19, which is wrong as a basic matter of transparency.
Also, reporting two-week snapshots could create, or contribute to, misperceptions about risk. For example, the August 26 weekly report stated that the average age of death in the prior two weeks (8/9 to 8/22) was 85.[8] Over the entire crisis, however, the average age of death appears to have been younger than 85 — the last such number reported (in the August 11 daily report) was 82.[9] Therefore, in the August 26 weekly report, the state’s new method of reporting may have omitted an average-age-of-death figure that was not only better-grounded in experience but also more cautionary.
[R]eporting two-week snapshots could create, or contribute to, misperceptions about risk.
In addition, the average-age-of-death figure reported on August 26 (85) quickly changed: the very next weekly report, the September 2 weekly report, stated that the average of death for the prior two weeks was 80[10] — a large shift in merely one week. This shift might relate to a recently-announced change in the criteria for identifying COVID-19 cases, though that announcement states that the new definition “has been used to update all the data – including the previously reported data.”[11] Regardless, the larger point stands: weekly reports based on two-week datasets are more susceptible to short term variations which could cause confusion, and perceptions of risk not grounded in the state’s broader experience with COVID-19. Moreover, lack of cumulative data for this metric could be especially serious if it masks lingering or new problems with the state’s nursing home populations.
Without doubt, the extensive COVID-19 reporting requires a great deal of work, and streamlining may in some circumstances be appropriate. Still, age-group reporting is an odd target for the sort of change addressed here. No less than data about the virus’s impact on individual cities, counties, or towns, data about the virus’s impact on different age groups is important, both for government decision-making, and also for personal decision-making – an individual wondering whether to return to the office, to send children back to school, to attend a wedding or funeral, or to gauge risk to elderly loved ones, should have ready access to age-group data that is up-to-date and complete.
Further, if necessary, the state could report the cumulative age-group data less frequently. It need not be reported every day. But the decision to stop entirely should be corrected.
Finally, DPH should review the first report containing its new age-group methodology: the August 12 weekly report. The age-group section of the report communicates that only 14 deaths occurred during the two covered weeks (7/26 to 8/8).[12] It appears that, in fact, more than 180 deaths occurred over that time period.[13] This points to another concern with the new approach: its short time period naturally magnifies any mistakes. While occasional unintentional errors are of course hard to avoid in the reporting of extensive and complex data, and this post does not mean to suggest otherwise, an error — such as mistakenly omitting some subset of data — obviously has a far greater mathematical and visual impact on a report covering a two-week time period than it would on a report covering a six-month or greater time period.
[1] https://www.bostonglobe.com/2020/03/10/nation/latest-coronavirus-numbers-massachusetts/
[2] September 16 weekly report (hereafter cited as “Sept. 16 Weekly Report”), page 32, at https://www.mass.gov/doc/weekly-covid-19-public-health-report-september-16-2020/download
[3] August 11 daily report (hereafter cited as “Aug. 11 Daily Report”), page 14, at https://www.mass.gov/doc/covid-19-dashboard-august-11-2020/download
[4] Sept. 16 Weekly Report, page 34.
[5] Aug. 11 Daily Report, page 15.
[6] Sept. 16 Weekly Report, page 35.
[7] Aug. 11 Daily Report, page 16.
[8] See page 35 of August 26 Weekly Report, at https://www.mass.gov/doc/weekly-covid-19-public-health-report-august-26-2020/download
[9] See page 16 of the August 11 Daily Report, at https://www.mass.gov/doc/covid-19-dashboard-august-11-2020/download
[10] See page 35 of the September 2 Weekly Report, at https://www.mass.gov/doc/weekly-covid-19-public-health-report-september-2-2020/download
[11] See page 1 of September 2 Daily Report, at https://www.mass.gov/doc/covid-19-dashboard-september-2-2020/download (emphasis added).
[12] See pages 37 and 38 of https://www.mass.gov/doc/weekly-covid-19-public-health-report-august-12-2020/download (visited September 16, 2020).
[13] See page 12 of the September 9 Daily Report, which communicates daily deaths without age breakdowns, and shows far more than 14 deaths between 7/26 and 8/8: https://www.mass.gov/doc/covid-19-dashboard-september-9-2020/download
Get Our COVID-19 News, Tips & Resources!
Related Posts
 https://pioneerinstitute.org/wp-content/uploads/Copy-of-WordPress-Blog-Post-Featured-Image-2.png
512
1024
Editorial Staff
https://pioneerinstitute.org/wp-content/uploads/logo_440x96.png
Editorial Staff2021-04-16 07:30:472021-04-26 10:01:55COVID-19 Vaccine Tracker
https://pioneerinstitute.org/wp-content/uploads/Copy-of-WordPress-Blog-Post-Featured-Image-2.png
512
1024
Editorial Staff
https://pioneerinstitute.org/wp-content/uploads/logo_440x96.png
Editorial Staff2021-04-16 07:30:472021-04-26 10:01:55COVID-19 Vaccine Tracker https://pioneerinstitute.org/wp-content/uploads/WordPress-Blog-Post-Featured-Image-5-1.png
512
850
Editorial Staff
https://pioneerinstitute.org/wp-content/uploads/logo_440x96.png
Editorial Staff2021-03-16 07:52:572021-03-16 08:03:19Pioneer Institute’s 2021 Government Transparency Resolutions: Sunshine Week Edition
https://pioneerinstitute.org/wp-content/uploads/WordPress-Blog-Post-Featured-Image-5-1.png
512
850
Editorial Staff
https://pioneerinstitute.org/wp-content/uploads/logo_440x96.png
Editorial Staff2021-03-16 07:52:572021-03-16 08:03:19Pioneer Institute’s 2021 Government Transparency Resolutions: Sunshine Week Edition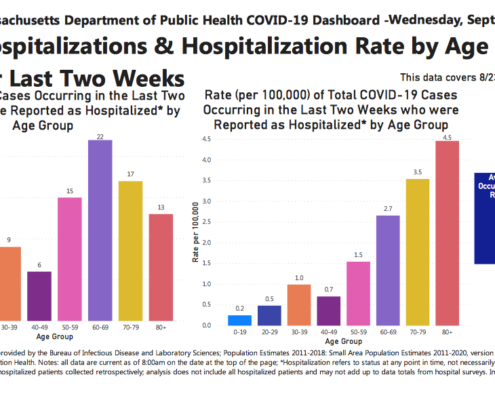 https://pioneerinstitute.org/wp-content/uploads/Image-for-Age-Group-Data-Blog-Post.png
590
1035
David Clancy
https://pioneerinstitute.org/wp-content/uploads/logo_440x96.png
David Clancy2020-09-17 10:48:222020-12-11 13:29:00COVID-19 Transparency – A Step Backwards
https://pioneerinstitute.org/wp-content/uploads/Image-for-Age-Group-Data-Blog-Post.png
590
1035
David Clancy
https://pioneerinstitute.org/wp-content/uploads/logo_440x96.png
David Clancy2020-09-17 10:48:222020-12-11 13:29:00COVID-19 Transparency – A Step Backwards https://pioneerinstitute.org/wp-content/uploads/Copy-of-Banner-2.png
512
1024
Jim Stergios
https://pioneerinstitute.org/wp-content/uploads/logo_440x96.png
Jim Stergios2020-09-01 10:34:422021-02-15 15:55:17Executive branch overreach, blanket orders having harmful effects
https://pioneerinstitute.org/wp-content/uploads/Copy-of-Banner-2.png
512
1024
Jim Stergios
https://pioneerinstitute.org/wp-content/uploads/logo_440x96.png
Jim Stergios2020-09-01 10:34:422021-02-15 15:55:17Executive branch overreach, blanket orders having harmful effects https://pioneerinstitute.org/wp-content/uploads/Untitled-design-49.png
512
1024
Editorial Staff
https://pioneerinstitute.org/wp-content/uploads/logo_440x96.png
Editorial Staff2020-06-28 22:30:372021-01-28 15:16:19Pioneer Urges Future COVID-19 Study and Recommendations Task Force to Consider Impact on Nursing Home Residents
https://pioneerinstitute.org/wp-content/uploads/Untitled-design-49.png
512
1024
Editorial Staff
https://pioneerinstitute.org/wp-content/uploads/logo_440x96.png
Editorial Staff2020-06-28 22:30:372021-01-28 15:16:19Pioneer Urges Future COVID-19 Study and Recommendations Task Force to Consider Impact on Nursing Home Residents https://pioneerinstitute.org/wp-content/uploads/Untitled-design-37.png
512
1024
Editorial Staff
https://pioneerinstitute.org/wp-content/uploads/logo_440x96.png
Editorial Staff2020-06-16 08:46:262021-10-29 15:21:49New Pioneer Institute Hotline Allows Public to Report Violations of Open Meeting Law
https://pioneerinstitute.org/wp-content/uploads/Untitled-design-37.png
512
1024
Editorial Staff
https://pioneerinstitute.org/wp-content/uploads/logo_440x96.png
Editorial Staff2020-06-16 08:46:262021-10-29 15:21:49New Pioneer Institute Hotline Allows Public to Report Violations of Open Meeting Law https://pioneerinstitute.org/wp-content/uploads/Untitled-design-33.png
512
1024
Rebekah Paxton
https://pioneerinstitute.org/wp-content/uploads/logo_440x96.png
Rebekah Paxton2020-06-09 08:49:182020-06-09 10:54:33Update: “Mapping COVID-19” Tool Now Shows Testing Data
https://pioneerinstitute.org/wp-content/uploads/Untitled-design-33.png
512
1024
Rebekah Paxton
https://pioneerinstitute.org/wp-content/uploads/logo_440x96.png
Rebekah Paxton2020-06-09 08:49:182020-06-09 10:54:33Update: “Mapping COVID-19” Tool Now Shows Testing Data https://pioneerinstitute.org/wp-content/uploads/Copy-of-Science-Education-Resources-During-COVID-19-1.png
512
1024
Barbara Anthony
https://pioneerinstitute.org/wp-content/uploads/logo_440x96.png
Barbara Anthony2020-05-20 11:18:242021-11-23 10:28:26In The Era Of COVID-19, Mass. Needs To Get Long-Term Care Right
https://pioneerinstitute.org/wp-content/uploads/Copy-of-Science-Education-Resources-During-COVID-19-1.png
512
1024
Barbara Anthony
https://pioneerinstitute.org/wp-content/uploads/logo_440x96.png
Barbara Anthony2020-05-20 11:18:242021-11-23 10:28:26In The Era Of COVID-19, Mass. Needs To Get Long-Term Care Right
