
Understanding Property Tax, Property Value, and Tax Levy Trends in Massachusetts
According to Pioneer Institute’s MassAnalysis tool, single family property tax bills in Massachusetts increased dramatically between 2003 and 2020. In 2003, the average single family property tax bill was $3,094. By 2020, the average property tax bill had nearly doubled to $5,969.
In general, property taxes represent the largest source of revenue for Massachusetts municipalities. Typically, differences in property values help inform tax rate discrepancies. For example, municipalities with low property values need higher tax rates to raise the same revenue as higher property value communities. Other factors, such as assessment rate and property tax exemptions or abatements also impact property tax bills.
The five municipalities with the highest average property tax bills for a single family home in 2020 were Weston, Lincoln, Sherborn, Wellesley, and Dover, respectively. The five communities with the lowest average property tax bills were Hancock, Rowe, Florida, Erving, and Monroe, respectively. (Note: Municipalities with no values listed for the average property tax bills for a single family were omitted from this analysis.) These data suggest that wealthy Boston suburbs have high property taxes, while rural areas of western Massachusetts have lower property tax bills.
Hancock was the municipality with the lowest property tax bill for a single family, with an average of only $712 (Figure 1). For comparison, the value of the municipality with the highest average property tax bill for a single family (Weston) is $20,922, about 30 times as large as Hancock’s average bill. Also, the average residential property value per capita of Hancock was $8,458, about half of that of Weston ($17,210).
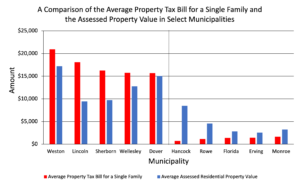
Figure 1. The average property tax bill for a single family and the average assessed property values in different municipalities of Massachusetts in 2020.
A tax levy is “the overall amount of revenue a city or town raises through the property tax.” In 2020, the five municipalities with the highest per capita average tax levies were Aquinnah, Chilmark, Truro, Nantucket, and Edgartown (respectively) on the Cape and Islands. (Note: Weston, Dover, and Sherborn were included in the list of the top 15 municipalities with the highest average tax levy.) In Aquinnah, the average tax levy per capita was $555, and it was $361 in Chilmark (Figure 2). In Truro and Nantucket, the average tax levy was $260. In that year, it was $247 in Edgartown.
In the same year, the five municipalities with the lowest average per capita tax levy were Erving, Lawrence, Hancock, Florida, and Fall River, respectively. (Note: Rowe was the municipality with the sixth lowest average tax levy per capita.) For comparison, in Erving the average tax levy per capita was $19. This value was $21 in Lawrence that year. In Hancock, Florida, and Fall River the average tax levy per capita was $24.

Figure 2. A comparison of the municipalities with the highest and lowest tax levy values per capita in 2020.
“Proposition 2 ½,” a measure approved by Massachusetts voters in 1980, imposes both a levy ceiling and a levy limit. According to the 2 ½ levy ceiling, “the amount raised in property taxes can never be more than 2½ percent of the full cash value of all taxable property in a city or town.” Additionally, the 2 ½ levy limit states that the change in property tax cannot exceed a 2 ½ percent increase from year to year. Because of these rules, property taxes are capped based on a municipality’s property values, and tax levies can only fluctuate minimally between years.
About the Author: Emily Donovan is a Roger Perry Government Transparency Intern at Pioneer Institute for the summer of 2021. She is a rising senior studying Animal Behavior at Bucknell University.

