Suffolk County Residential and Commercial Taxation Changes Since 2018
Massachusetts is a relatively rich state, with an average assessed home value of $194,497 per capita. Many of the Commonwealth’s communities have undergone significant changes in the last several years. For example, Suffolk County, which includes Boston, Revere, Winthrop, and Chelsea, has faced fluctuations in home development and taxation since 2018.
Boston, being the largest urban hub in New England, makes up the lion’s share of residential parcels in Suffolk County – 150,999 in 2023, or over 85 percent of all parcels. Since 2018, residential parcels in Suffolk County have increased in every town: from 141,642 to 150,999 in Boston, 13,347 to 13,421 in Revere, 5,648 to 5,707 in Chelsea, and from 5,243 to 5,344 in Winthrop.
Furthermore, Suffolk County has an average assessed home value per capita nearly $10,000 more than the state average ($204,531 vs. $194,497). Boston in particular has undergone significant valuation changes since 2018. That year, the average assessed value per capita was $123,474 or $10,000 less than the state average, which was $133,840.
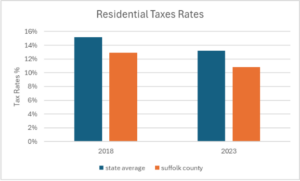
Because Suffolk County has a higher average assessed value per capita, it may be expected that the residential tax would in turn be higher. However, Suffolk County has a tax rate of 10.83 percent, more than two percentage points below the state average of 13.20 percent in 2023. In 2018, the Suffolk County tax rate of 12.93 percent was also lower than the state average of 15.15 percent.

Figure 1: MassAnalysis (2018, 2023)
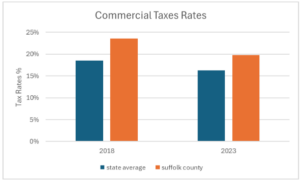
One reason for this may be Suffolk County’s relatively high commercial taxes. In 2023, Suffolk County’s average commercial tax rate was 19.81 percent, almost four percentage points above the state average of 16.26 percent. The average commercial tax rate in Suffolk County is primarily brought up by Boston and Chelsea’s high commercial tax rates of 24.68 and 24.88 percent, respectively. Furthermore, Boston’s high commercial tax rates help make the city’s total commercial tax levy of $1,500,027,795, by far the highest in Massachusetts. From this information, we can infer that Suffolk County’s comparatively low residential taxes are at least in part due to the large amount of revenue generated from commercial real estate taxes.
A similar situation existed in 2018, when the residential tax rate of 12.93 percent was significantly lower than the state average of 15.15 percent. At 23.62 percent the commercial real estate tax rate was also significantly higher than the state average of 18.58 percent.
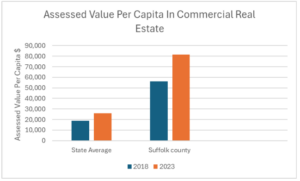
Moreover, between 2018 and 2023, the total commercial tax levy rose by over $300 million, to $1.17 billion, even though commercial and residential tax rates both went down over the period. This most likely is due to the increase in assessed value of commercial real estate from 2018 to 2023. In 2018, the average assessed value of commercial real estate in Suffolk County was $56,022 per capita, compared to the state average of $18,835. Furthermore, in 2023 the average assessed value per capita in Suffolk County was $81,544, compared to the state average of $26,092.
In conclusion, commercial tax rates in Suffolk County have consistently been much higher than the state average, while residential taxes have consistently been lower. We can infer that the large number of commercial buildings in Suffolk County and their high tax rates make up for the county’s relatively low residential tax rates.

Figure 2: MassAnalysis (2018, 2023)

Figure 3: MassAnalysis (2018, 2023)
About the Author: Axel Portnoy is a Roger Perry Transparency Intern at Pioneer Institute for the summer of 2024. He is a rising senior at Milton Academy.


