
State Ranking: Michigan, Hawaii, Rhode Island, Pennsylvania, and Nevada have been hardest-hit by COVID-19 jobless claims so far. Massachusetts ranks as 9th hardest-hit.
By Gregory Sullivan
April 9, 2020
The U.S. Department of Labor reported today that in the week ended April 4, the advance number of seasonally-adjusted initial jobless claims was 6,606,000. This follows 6,867,000 initial claims filed in the week ended March 28 and 3,307,000 in the week ended March 21.
Each of these weekly jobless figures exceeds the previous record in the seasonally adjusted series of the U.S. Department of Labor that began in January 1967. The previous record for initial weekly claims was 695,000 in the week ended October 2, 1982. The peak during the Great Recession was 665,000 in the week ended March 28, 1990.
The three-week total of 16,780,000 seasonally-adjusted initial jobless claims is an astounding number, considering that the total number of people collecting unemployment during the week ended March 14 was 1,702,000.
The U.S. Department of Labor also reports unadjusted initial weekly claims by state. Figure 1 ranks the states by the total number of initial jobless claims in weeks ended March 21, March 28, and April 4 as a percentage of each state’s February 2020 civilian labor force, as reported by the U.S. Bureau of Labor Statistics.. Pioneer Institute’s analysis shows that the states of Michigan, Hawaii, Rhode Island, Pennsylvania and Nevada have been most adversely affected by COVID-19 jobless claims so far, while South Dakota, West Virginia, Colorado, Wyoming, and Florida have been the least adversely affected.
Figure 1. State ranking of total unadjusted initial jobless claims in weeks ended March 21, March 28, and April 4 as a percentage of each state’s February 2020 civilian labor force.
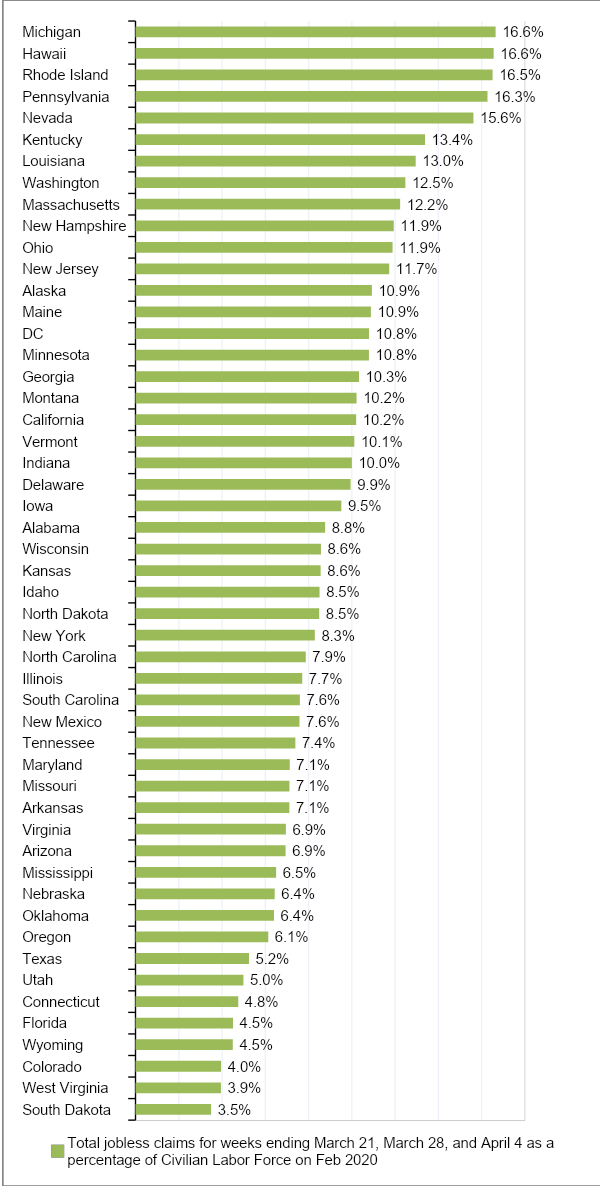
Source: U.S. Bureau of Labor Statistics; U.S. Department of Labor, analysis by Pioneer Institute.
| STATE | Civilian Labor Force Feb 2020 | Total jobless claims, weeks ended March 21, March 28, and April 4 | Total jobless claims for weeks ended March 21, March 28, and April 4 as a percentage of Civilian Labor Force on Feb 2020 |
| Michigan | 4,950,003 | 823,936 | 16.6% |
| Hawaii | 669,073 | 110,758 | 16.6% |
| Rhode Island | 558,452 | 92,169 | 16.5% |
| Pennsylvania | 6,558,209 | 1,067,049 | 16.3% |
| Nevada | 1,559,531 | 243,582 | 15.6% |
| Kentucky | 2,083,955 | 278,884 | 13.4% |
| Louisiana | 2,109,846 | 273,253 | 13.0% |
| Washington | 3,962,600 | 494,237 | 12.5% |
| Massachusetts | 3,834,913 | 469,096 | 12.2% |
| New Hampshire | 779,489 | 93,047 | 11.9% |
| Ohio | 5,829,061 | 692,620 | 11.9% |
| New Jersey | 4,564,238 | 535,227 | 11.7% |
| Alaska | 345,422 | 37,740 | 10.9% |
| Maine | 695,024 | 75,625 | 10.9% |
| DC | 414,340 | 44,723 | 10.8% |
| Minnesota | 3,121,259 | 336,788 | 10.8% |
| Georgia | 5,156,201 | 532,701 | 10.3% |
| Montana | 537,323 | 54,900 | 10.2% |
| California | 19,515,998 | 1,990,510 | 10.2% |
| Vermont | 340,147 | 34,403 | 10.1% |
| Indiana | 3,396,036 | 339,637 | 10.0% |
| Delaware | 489,107 | 48,626 | 9.9% |
| Iowa | 1,752,764 | 166,739 | 9.5% |
| Alabama | 2,243,967 | 196,685 | 8.8% |
| Wisconsin | 3,109,079 | 266,531 | 8.6% |
| Kansas | 1,496,507 | 128,058 | 8.6% |
| Idaho | 891,650 | 75,848 | 8.5% |
| North Dakota | 404,494 | 34,346 | 8.5% |
| New York | 9,551,755 | 791,648 | 8.3% |
| North Carolina | 5,114,589 | 402,537 | 7.9% |
| Illinois | 6,398,842 | 493,187 | 7.7% |
| South Carolina | 2,391,831 | 181,700 | 7.6% |
| New Mexico | 961,708 | 72,893 | 7.6% |
| Tennessee | 3,365,911 | 248,710 | 7.4% |
| Maryland | 3,280,471 | 233,925 | 7.1% |
| Missouri | 3,111,784 | 221,379 | 7.1% |
| Arkansas | 1,367,278 | 97,211 | 7.1% |
| Virginia | 4,462,717 | 310,139 | 6.9% |
| Arizona | 3,613,058 | 250,601 | 6.9% |
| Mississippi | 1,276,525 | 82,969 | 6.5% |
| Nebraska | 1,042,417 | 67,060 | 6.4% |
| Oklahoma | 1,844,281 | 118,020 | 6.4% |
| Oregon | 2,105,464 | 129,202 | 6.1% |
| Texas | 14,200,106 | 744,855 | 5.2% |
| Utah | 1,630,696 | 81,326 | 5.0% |
| Connecticut | 1,930,492 | 91,700 | 4.8% |
| Florida | 10,455,537 | 471,198 | 4.5% |
| Wyoming | 294,173 | 13,228 | 4.5% |
| Colorado | 3,186,421 | 126,052 | 4.0% |
| West Virginia | 806,517 | 31,847 | 3.9% |
| South Dakota | 467,060 | 16,322 | 3.5% |
Source: U.S. Bureau of Labor Statistics; U.S. Department of Labor, analysis by Pioneer Institute.
Gregory W. Sullivan is the Research Director at the Pioneer Institute, overseeing the divisions PioneerPublic and PioneerOpportunity. He also previously served as Inspector General of the Commonwealth of Massachusetts for 10 years and in the Massachusetts House of Representatives for 17 years. Mr. Sullivan has a Master’s degree in public administration from the Kennedy School at Harvard University and a second Master’s degree concentrating in finance from the Sloan School at MIT.

