No Clear Correlation Between Fare Revenue and Ridership
In recent weeks, many MBTA riders have expressed frustration about the T’s recent fare hike. In fact, some riders are volunteering to stand on platforms and lead a conversation about what riders can do to roll back the hike. However, the T is unlikely to budge. Even when ridership declines for a period, fare revenue continues to climb.
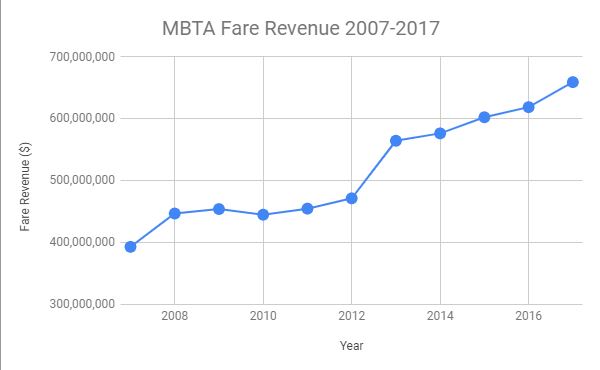
The last three fare hikes occurred in 2012, 2014, and 2016. While all three led to a decrease in unlinked passenger trips the following year, they generated an increase in fare revenue. In fact, fare revenue increased every year from 2007-2017, with the exception of 2010. Further, the largest increase in fare revenue actually came in a year in which ridership declined. According to Pioneer Institute’s MBTAAnalysis.com, from 2012 to 2013, fare revenue increased by 19.7% even as ridership decreased by 1.6%. Moreover, when ridership grew by 7% in 2011, its largest increase between 2007 and 2017, fare revenue only rose by 2.2%. When the T implements Automated Fare Collection 2.0 and works the early bugs out of the system, even higher revenue can be expected.
While some riders feel service quality hasn’t improved enough to merit a fare increase, state law allows the MBTA to raise fares no more than 7 percent once every two years. Further, riders should be aware that in 2017 the T was the fourth largest transportation network in the United States in unlinked passenger trips, but ranked sixth in total fare revenue.
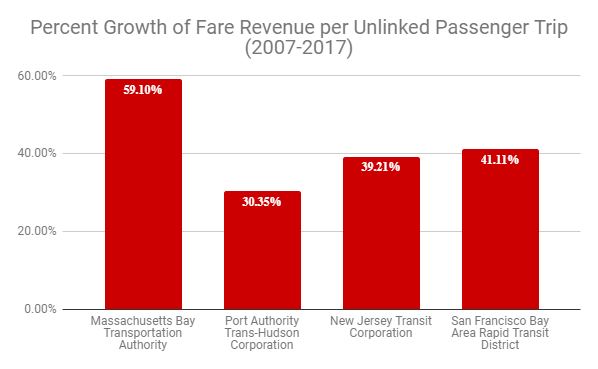
However, the fare revenue per unlinked passenger trip increased by 60 percent between 2007 and 2017, which is nearly 20 percentage points more than its closest peer system. While a fare hike is nothing new, riders are right to demand that it correspond with improved service.
Get Our Fix the T Updates!
Related posts:
Harris Foulkes is a Roger Perry Transparency Intern at Pioneer Institute and a rising sophomore at Amherst College studying Economics.

