Employment trends in the Greater Boston Area and Touristy Massachusetts Counties during the COVID-19 Pandemic
Using MassEconomix, Pioneer Institute’s database on employment and the economy, county-level business concentration and employment trends can be observed. Thousands of Americans lost their jobs during the COVID-19 pandemic. Not only was this drop in employment apparent in the Boston area, but also in less densely populated Massachusetts counties. Those reliant on tourism also lost jobs.
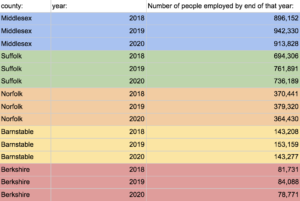
Table 1 shows the total number of people employed in the Middlesex, Suffolk, Norfolk, Barnstable, and Berkshire counties over the past three years. In general, every county had an increase in its employee count from 2018 to 2019 but then a severe decrease from 2019 to 2020, due to the COVID-19 pandemic.

Table 1
https://masseconomix.org/geography/filter-county

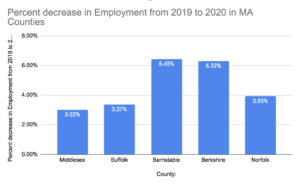
Figure 1
https://masseconomix.org/geography/filter-county
While counties in Greater Boston had a 3 to 4 percent decrease in employment from 2019-2020, the more touristy counties, Barnstable and Berkshire, suffered a more severe employment drop from 2019-2020 with about a 6.4 percent decrease in employment as seen in figure 1.
According to this article, a possible reason for this trend is the increased government benefits that many Massachusetts citizens received due to the COVID-19 virus. With the increase in government stimulus checks and new government unemployment benefits, many of those who had been working have been, and continue to be, wary of returning to their low-paying jobs. According to this article by WBUR, many establishments in Cape Cod are having trouble finding workers due to pandemic-related international travel bans.
|
county: Middlesex and Suffolk
|
|
| municipality: |
infection rate per 100,000 people
|
| Boston | 10,241 |
| Brookline | 3,535 |
| Newton | 4,774 |
| Milton | 8,293 |
| Dedham | 8,995 |
| Wellesley | 4,564 |
|
county: Barnstable
|
|
| municipality: |
infection rate per 100,000 people
|
| Sandwich | 5,788 |
| Falmouth | 5,050 |
| Mashpee | 5,671 |
| Barnstable | 9,430 |
| Chatham | 5,609 |
| Orleans | 5,249 |
|
county: Birkshire
|
|
| municipality: |
infection rate per 100,000 people
|
| Williamstown | 4,137 |
| Pittsfield | 6,830 |
| Lenox | 5,007 |
| Richmond | 3,219 |
| Stockbridge | 4,103 |
https://pioneerinstitute.org/news/mapping-covid-19-in-massachusetts-cities-towns/
Tables 2, 3, and 4
Using Pioneer Institute’s COVID-19 tracking database, one can observe the COVID-19 infection rates per municipality in the tables above as of June 2021. The municipalities were chosen because they are either in Boston area counties (Middlesex and Suffolk), Barnstable, or Berkshire. According to the database, every municipality listed above, except Boston, was below the Massachusetts state average COVID-19 infection rate. Therefore, areas with low infection rates did not necessarily maintain more of their workforce.
For example, municipalities in the Berkshires generally had lower COVID-19 infection rates compared to municipalities in the Suffolk and Middlesex counties. However, Suffolk and Middlesex suffered less severe drops in employment than the Berkshires. A possible reason for this trend is that municipalities in the Suffolk and Middlesex counties are on average more densely populated compared to Barnstable and Berkshire. According to the CDC, because one would be at a higher risk to contract the COVID-19 virus in a more densely populated area, less densely populated areas such as municipalities in the Berkshires and on Cape Cod might have been safer places to live.
As Pioneer Institute’s databases continue to be updated it will be interesting to see the employment trends in these areas into 2022 and beyond.
Nathan Bornstein is a Roger Perry Intern at Pioneer Institute. He is a rising senior high school student at the Buckingham Browne & Nichols school in Cambridge, Massachusetts. His favorite subjects at school are history, math, and foreign language.


