WCVB Team 5 Reports on Pioneer’s Analysis of $92M Boston Fire Contract
Pioneer Institute Executive Director Greg Sullivan appeared on a WCVB Team 5 Investigates news report about the City of Boston’s $92 million contract with the Fire Department, which disproportionately benefits highly paid administrators and supervisors over rank and file firefighters.
Watch the WCVB video here. Read the story here.
Study: Boston fire, EMS most expensive in US
148 supervisors earn more than Gov. Deval Patrick
Team 5 Investigates exclusive new details about the $92 million deal just inked for the city of Boston’s firefighters.
Read more: http://www.wcvb.com/news/study-boston-fire-ems-most-expensive-in-us/26405806#ixzz34F21XGpT
Greg Sullivan said, ““The top brass is overstaffed and overpaid.”
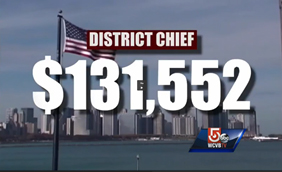
These graphics from the WCVB report compare the average salaries of district chiefs in 4 large cities: Baltimore, Chicago, New York City, and Boston:
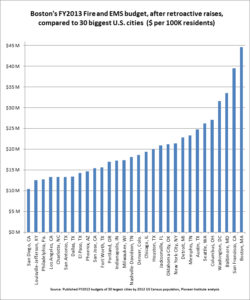
Boston’s FY2013 Fire Department and EMS budget, after the proposed FY2013 retroactive pay hike, will be the most expensive of the 30 biggest U.S. cities adjusted for population, more than twice the national average, and more than twice as high as New York’s, Chicago’s, Houston’s, Los Angeles’, and Philadelphia’s. The proposed Boston Fire Department collective bargaining agreement includes $92.4 million in increased compensation for fire department employees, including $21 million in retroactive pay raises.
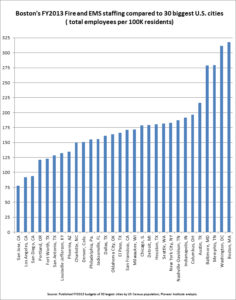
Boston’s ranking as most expensive among major U.S. cities is attributable to a combination of high staffing and compensation levels. The following three graphs show that Boston will have the highest cost per 100K residents for fire and EMS departments if the collective bargaining agreement is approved. Its total budget cost per 100,000 residents is 82% higher than the national average.
Boston’s staffing level per 100,000 residents is more than double the 30 city average.
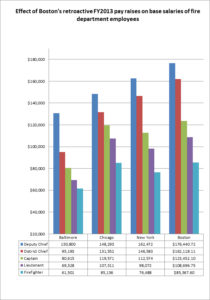
A graph comparing Boston’s FY2013 base salary for Deputy Chiefs, District Chiefs, Captains, Lieutenants, and Firefighters to Baltimore’s, Chicago’s, and New York’s, after Boston’s proposed retroactive FY2013 pay hike, shows that Boston’s compensation levels are highest, especially for high ranking officials. CLICK CHARTS TO ENLARGE
The following chart provides information derived from FY2013 fire department and EMS budgets of the 30 largest U.S. cities by population, including regular and overtime compensation, operational expenses, pension, and insurance costs. Twenty-seven of these cities have combined fire/EMS departments. Boston, Austin, and Louisville maintain separate departments. Boston’s budget cost per 100,000 population is highest of the thirty cities, 117.9% higher than average. Combined Fire/EMS staffing is also the highest of the 30 cities, 82.4% higher than average.
| City | 2012 Population | Fire & EMS employees | Fire & EMS budget FY2013 | Budget per 100K population | Staffing per 100K population |
| San Jose, CA | 982,765 | 763 | $151,489,191 | $15,414,590 | 77.6 |
| Los Angeles, CA | 3,857,799 | 3,537 | $513,444,773 | $13,309,267 | 91.7 |
| San Diego, CA | 1,338,348 | 1,256 | $139,626,195 | $10,432,727 | 93.8 |
| Portland, OR | 603,106 | 730 | $102,371,706 | $16,974,082 | 121.1 |
| Fort Worth, TX | 777,992 | 955 | $121,322,144 | $15,594,266 | 122.8 |
| San Antonio, TX | 1,382,951 | 1,780 | $184,480,501 | $13,339,627 | 128.7 |
| Louisville-Jefferson, KY | 605,110 | 799 | $75,964,800 | $12,553,883 | 132.0 |
| Phoenix, AZ | 1,488,750 | 2,006 | $218,031,000 | $14,645,239 | 134.7 |
| Charlotte, NC | 775,202 | 1,166 | $103,213,098 | $13,314,349 | 150.4 |
| Denver, Colo. | 634,265 | 955 | $117,847,174 | $18,580,116 | 150.6 |
| Philadelphia, Pa. | 1,547,607 | 2,403 | $197,180,578 | $12,740,998 | 155.3 |
| Jacksonville, FL | 836,507 | 1,301 | $174,752,000 | $20,890,680 | 155.5 |
| Dallas, TX | 1,241,162 | 2,000 | $166,361,735 | $13,403,708 | 161.1 |
| Oklahoma City, OK | 599,199 | 980 | $126,980,406 | $21,191,692 | 163.6 |
| El Paso, TX | 672,538 | 1,118 | $95,967,319 | $14,269,427 | 166.3 |
| San Francisco, CA | 825,863 | 1,412 | $326,072,813 | $39,482,676 | 171.0 |
| Milwaukee, WI | 598,916 | 1,028 | $103,873,222 | $17,343,538 | 171.6 |
| Chicago, IL | 2,714,856 | 4,845 | $525,789,677 | $19,367,129 | 178.5 |
| Detroit, MI | 701,475 | 1,257 | $159,954,156 | $22,802,545 | 179.2 |
| Houston, TX | 2,160,821 | 3,895 | $433,391,234 | $20,056,786 | 180.3 |
| Seattle, WA | 634,535 | 1,153 | $166,266,890 | $26,202,950 | 181.6 |
| New York City, NY | 8,336,697 | 15,236 | $1,785,329,000 | $21,415,304 | 182.8 |
| Nashville-Davidson, TN | 624,496 | 1,170 | $112,923,100 | $18,082,278 | 187.4 |
| Indianapolis, IN | 834,852 | 1,600 | $143,749,605 | $17,218,573 | 191.7 |
| Columbus, OH | 809,798 | 1,589 | $218,691,298 | $27,005,660 | 196.2 |
| Austin, TX | 842,592 | 1,823 | $208,636,371 | $24,761,257 | 216.3 |
| Baltimore, MD | 621,342 | 1,732 | $208,014,415 | $33,478,248 | 278.8 |
| Memphis, TN | 655,155 | 1,829 | $152,489,577 | $23,275,344 | 279.2 |
| Washington, DC | 632,323 | 1,969 | $199,373,728 | $31,530,362 | 311.4 |
| Boston, MA | 636,479 | 2,024 | $283,565,537 | $44,552,222 | 318.0 |
| Average of 30 cities | $20,440,984 | 174.3 | |||
| Boston, MA | $44,552,222 | 318.0 | |||
| Boston, MA rank | 1 | 1 | |||
| Boston vs average | 217.96% | 182.44% |
Boston’s high Fire Department/EMS costs result from a combination of high staffing levels and high compensation levels. The following is a graph comparing Boston’s regular 2013 salary levels for Deputy Chiefs, District Chiefs, Captains, Lieutenants, and Fire Fighters to three major U.S. cities that make such information publicly available.

