
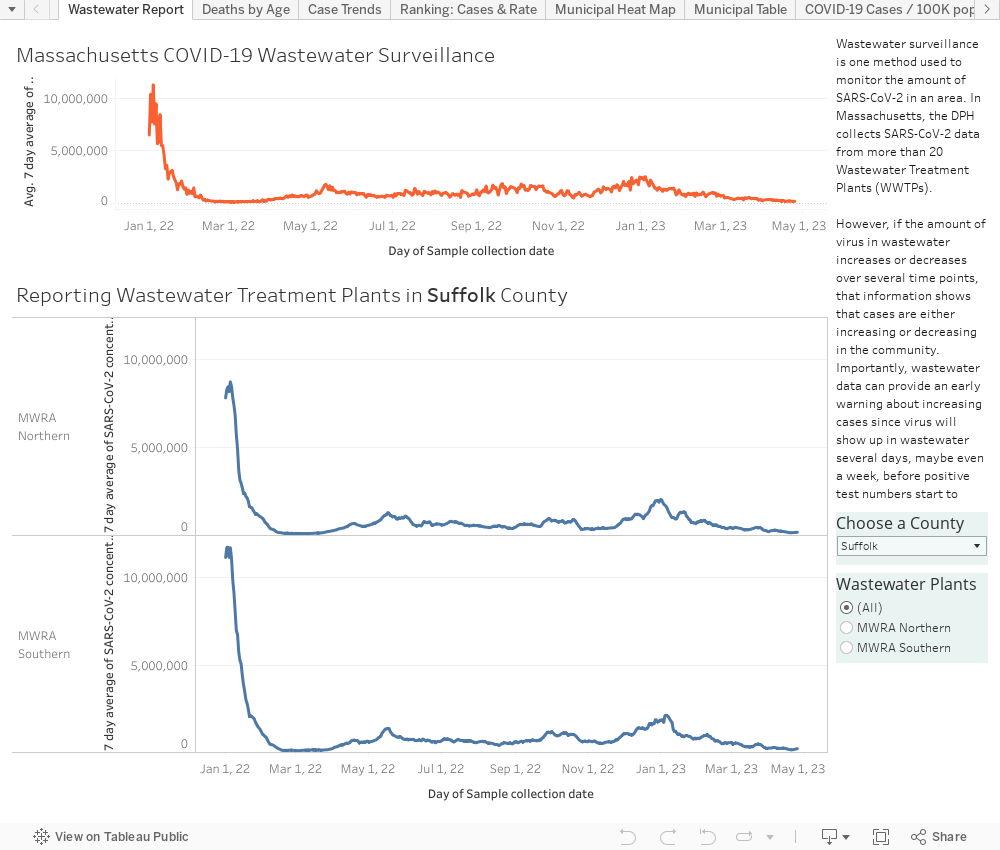
Mapping COVID-19 in Massachusetts Cities & Towns
Kudos to the Baker Administration for providing transparency in a critical matter of public safety. As Pioneer Institute’s Senior Fellow in Healthcare, Barbara Anthony, urged in The Boston Globe, the Massachusetts Department of Public Health upped its game and started posting the count and rate (per 100,000) of confirmed COVID-19 Cases in Massachusetts by City/Town. They will update the numbers each Wednesday. https://www.mass.gov/info-details/covid-19-cases-quarantine-and-monitoring
Taking this data, Pioneer created different ways to view the data:
-
- Scatter charts – Showing cases by population, with and without Boston (which is the outlier).
- Rankings – Largest to smallest number of cases and rate (cases per 100K population)
- Heat Maps – Of the infection rate, by county and municipality
- Table – By municipality & county, of the total number of cases, rate of infection, and the population (for reference)
- Testing – Graphs, a table and map showing number of people tested, testing rate per 100K population, and percent of positive tests.
Note: For populations <50,000, <5 cases are reported as such or suppressed for confidentiality purposes. In our graphs and tables, for those small towns with some reported cases, we assigned them 3 cases so the maps would draw correctly.
We plan to update the maps during the crisis after DPH releases weekly data.
Get Our COVID-19 News, Tips & Resources!
 https://pioneerinstitute.org/wp-content/uploads/Jason-Bedrick-EdChoice-8.png
512
1024
Editorial Staff
https://pioneerinstitute.org/wp-content/uploads/logo_440x96.png
Editorial Staff2020-06-05 10:46:572023-08-26 12:28:42MA Commissioner Jeff Riley on Remote Learning, Voc-Techs, & Reforming Boston’s Schools
https://pioneerinstitute.org/wp-content/uploads/Jason-Bedrick-EdChoice-8.png
512
1024
Editorial Staff
https://pioneerinstitute.org/wp-content/uploads/logo_440x96.png
Editorial Staff2020-06-05 10:46:572023-08-26 12:28:42MA Commissioner Jeff Riley on Remote Learning, Voc-Techs, & Reforming Boston’s Schools https://pioneerinstitute.org/wp-content/uploads/Copy-of-Science-Education-Resources-During-COVID-19-1-1.png
512
1024
Tom Birmingham
https://pioneerinstitute.org/wp-content/uploads/logo_440x96.png
Tom Birmingham2020-06-05 10:19:562020-06-11 06:32:21Easthampton High Scores A National Educational Victory During The COVID-19 Pandemic
https://pioneerinstitute.org/wp-content/uploads/Copy-of-Science-Education-Resources-During-COVID-19-1-1.png
512
1024
Tom Birmingham
https://pioneerinstitute.org/wp-content/uploads/logo_440x96.png
Tom Birmingham2020-06-05 10:19:562020-06-11 06:32:21Easthampton High Scores A National Educational Victory During The COVID-19 Pandemic https://pioneerinstitute.org/wp-content/uploads/COVID-19-Guidance-for-Schools-2.png
512
1024
Editorial Staff
https://pioneerinstitute.org/wp-content/uploads/logo_440x96.png
Editorial Staff2020-06-04 07:02:492020-07-17 13:40:41Experts Find K-12 Online Education Can Be Appropriate for Most Special Needs Students
https://pioneerinstitute.org/wp-content/uploads/COVID-19-Guidance-for-Schools-2.png
512
1024
Editorial Staff
https://pioneerinstitute.org/wp-content/uploads/logo_440x96.png
Editorial Staff2020-06-04 07:02:492020-07-17 13:40:41Experts Find K-12 Online Education Can Be Appropriate for Most Special Needs Students https://pioneerinstitute.org/wp-content/uploads/Untitled-design-32.png
512
1024
Editorial Staff
https://pioneerinstitute.org/wp-content/uploads/logo_440x96.png
Editorial Staff2020-06-03 07:59:522021-02-15 15:17:55Pioneer Institute Looks Ahead to the Protection of Civil Liberties
https://pioneerinstitute.org/wp-content/uploads/Untitled-design-32.png
512
1024
Editorial Staff
https://pioneerinstitute.org/wp-content/uploads/logo_440x96.png
Editorial Staff2020-06-03 07:59:522021-02-15 15:17:55Pioneer Institute Looks Ahead to the Protection of Civil Liberties https://pioneerinstitute.org/wp-content/uploads/Exhibit-A_-We-Need-Access-to-SFIs-Now-15.png
512
1024
Editorial Staff
https://pioneerinstitute.org/wp-content/uploads/logo_440x96.png
Editorial Staff2020-06-02 14:18:282020-06-02 14:18:28COVID-19 Roundup from Pioneer: Antibodies & immunity; Talking about WHO; Telecommuting Survey Results; Mapping COVID – Update; & more!
https://pioneerinstitute.org/wp-content/uploads/Exhibit-A_-We-Need-Access-to-SFIs-Now-15.png
512
1024
Editorial Staff
https://pioneerinstitute.org/wp-content/uploads/logo_440x96.png
Editorial Staff2020-06-02 14:18:282020-06-02 14:18:28COVID-19 Roundup from Pioneer: Antibodies & immunity; Talking about WHO; Telecommuting Survey Results; Mapping COVID – Update; & more! https://pioneerinstitute.org/wp-content/uploads/pexels-photo-917494.jpg
1300
1769
Andrew Mikula
https://pioneerinstitute.org/wp-content/uploads/logo_440x96.png
Andrew Mikula2020-06-02 09:50:452020-06-10 13:29:48Even for the most remote part of Massachusetts (Franklin County), it’s far from business as usual
https://pioneerinstitute.org/wp-content/uploads/pexels-photo-917494.jpg
1300
1769
Andrew Mikula
https://pioneerinstitute.org/wp-content/uploads/logo_440x96.png
Andrew Mikula2020-06-02 09:50:452020-06-10 13:29:48Even for the most remote part of Massachusetts (Franklin County), it’s far from business as usual https://pioneerinstitute.org/wp-content/uploads/The-Learning-Curve-18.png
512
1024
Editorial Staff
https://pioneerinstitute.org/wp-content/uploads/logo_440x96.png
Editorial Staff2020-06-02 09:32:132020-06-02 09:32:13Hubwonk Ep. 8: Who is WHO? COVID-19, Massachusetts, and the unhealthy World Health Organization
https://pioneerinstitute.org/wp-content/uploads/The-Learning-Curve-18.png
512
1024
Editorial Staff
https://pioneerinstitute.org/wp-content/uploads/logo_440x96.png
Editorial Staff2020-06-02 09:32:132020-06-02 09:32:13Hubwonk Ep. 8: Who is WHO? COVID-19, Massachusetts, and the unhealthy World Health Organization https://pioneerinstitute.org/wp-content/uploads/GOING-UP_-The-Challenge-of-Reopening-Shared-Office-Buildings.png
512
1024
Editorial Staff
https://pioneerinstitute.org/wp-content/uploads/logo_440x96.png
Editorial Staff2020-06-01 07:13:272021-01-28 14:53:34Study: Safely Reopening Office Buildings Will Require Planning, Innovation
https://pioneerinstitute.org/wp-content/uploads/GOING-UP_-The-Challenge-of-Reopening-Shared-Office-Buildings.png
512
1024
Editorial Staff
https://pioneerinstitute.org/wp-content/uploads/logo_440x96.png
Editorial Staff2020-06-01 07:13:272021-01-28 14:53:34Study: Safely Reopening Office Buildings Will Require Planning, Innovation https://pioneerinstitute.org/wp-content/uploads/The-Learning-Curve-16.png
512
1024
Editorial Staff
https://pioneerinstitute.org/wp-content/uploads/logo_440x96.png
Editorial Staff2020-05-29 09:54:542023-08-26 12:29:10Acclaimed Poet & Former NEA Chairman Dana Gioia on Poetry & Arts Education
https://pioneerinstitute.org/wp-content/uploads/The-Learning-Curve-16.png
512
1024
Editorial Staff
https://pioneerinstitute.org/wp-content/uploads/logo_440x96.png
Editorial Staff2020-05-29 09:54:542023-08-26 12:29:10Acclaimed Poet & Former NEA Chairman Dana Gioia on Poetry & Arts Education https://pioneerinstitute.org/wp-content/uploads/man-having-a-phone-call-in-front-of-a-laptop-859264-scaled.jpg
1707
2560
Greg Sullivan
https://pioneerinstitute.org/wp-content/uploads/logo_440x96.png
Greg Sullivan2020-05-28 14:04:542020-05-28 16:33:3838.8 percent of the Massachusetts workforce and 28.3 percent of the U.S. workforce have filed unemployment claims over the past ten weeks.
https://pioneerinstitute.org/wp-content/uploads/man-having-a-phone-call-in-front-of-a-laptop-859264-scaled.jpg
1707
2560
Greg Sullivan
https://pioneerinstitute.org/wp-content/uploads/logo_440x96.png
Greg Sullivan2020-05-28 14:04:542020-05-28 16:33:3838.8 percent of the Massachusetts workforce and 28.3 percent of the U.S. workforce have filed unemployment claims over the past ten weeks. https://pioneerinstitute.org/wp-content/uploads/people-wearing-backpacks-1454360-scaled.jpg
1707
2560
Andrew Mikula
https://pioneerinstitute.org/wp-content/uploads/logo_440x96.png
Andrew Mikula2020-05-28 09:43:362020-05-28 09:44:49Once anchored by higher education, Hampshire County, MA finds itself out of work after a cancelled semester
https://pioneerinstitute.org/wp-content/uploads/people-wearing-backpacks-1454360-scaled.jpg
1707
2560
Andrew Mikula
https://pioneerinstitute.org/wp-content/uploads/logo_440x96.png
Andrew Mikula2020-05-28 09:43:362020-05-28 09:44:49Once anchored by higher education, Hampshire County, MA finds itself out of work after a cancelled semester https://pioneerinstitute.org/wp-content/uploads/unrecognizable-person-standing-by-calm-lake-near-autumn-3934001-scaled.jpg
2560
1707
Andrew Mikula
https://pioneerinstitute.org/wp-content/uploads/logo_440x96.png
Andrew Mikula2020-05-27 15:37:542020-05-27 12:56:34In Hampden County, COVID-19 exacerbates a stark employment divide between urban and rural areas
https://pioneerinstitute.org/wp-content/uploads/unrecognizable-person-standing-by-calm-lake-near-autumn-3934001-scaled.jpg
2560
1707
Andrew Mikula
https://pioneerinstitute.org/wp-content/uploads/logo_440x96.png
Andrew Mikula2020-05-27 15:37:542020-05-27 12:56:34In Hampden County, COVID-19 exacerbates a stark employment divide between urban and rural areas https://pioneerinstitute.org/wp-content/uploads/breaking-the-code_.png
512
1024
Editorial Staff
https://pioneerinstitute.org/wp-content/uploads/logo_440x96.png
Editorial Staff2020-05-27 06:29:132021-10-28 13:43:16Study: Officials Must Address Basic Questions to Improve Public School Computer Science Education
https://pioneerinstitute.org/wp-content/uploads/breaking-the-code_.png
512
1024
Editorial Staff
https://pioneerinstitute.org/wp-content/uploads/logo_440x96.png
Editorial Staff2020-05-27 06:29:132021-10-28 13:43:16Study: Officials Must Address Basic Questions to Improve Public School Computer Science Education https://pioneerinstitute.org/wp-content/uploads/The-Learning-Curve-15.png
512
1024
Editorial Staff
https://pioneerinstitute.org/wp-content/uploads/logo_440x96.png
Editorial Staff2020-05-26 12:17:252020-05-28 09:42:20Hubwonk Ep. 7: Covid Testing: What went wrong, where we are & when we’ll get closer to normalcy
https://pioneerinstitute.org/wp-content/uploads/The-Learning-Curve-15.png
512
1024
Editorial Staff
https://pioneerinstitute.org/wp-content/uploads/logo_440x96.png
Editorial Staff2020-05-26 12:17:252020-05-28 09:42:20Hubwonk Ep. 7: Covid Testing: What went wrong, where we are & when we’ll get closer to normalcy https://pioneerinstitute.org/wp-content/uploads/beige-concrete-house-near-sea-2191639-scaled.jpg
2560
1649
Andrew Mikula
https://pioneerinstitute.org/wp-content/uploads/logo_440x96.png
Andrew Mikula2020-05-26 09:36:372020-05-25 11:16:32As stay-at-home orders remain in place at the start of summer tourist season, COVID-19 takes a bite out of resort towns’ economies
https://pioneerinstitute.org/wp-content/uploads/beige-concrete-house-near-sea-2191639-scaled.jpg
2560
1649
Andrew Mikula
https://pioneerinstitute.org/wp-content/uploads/logo_440x96.png
Andrew Mikula2020-05-26 09:36:372020-05-25 11:16:32As stay-at-home orders remain in place at the start of summer tourist season, COVID-19 takes a bite out of resort towns’ economies https://pioneerinstitute.org/wp-content/uploads/The-Learning-Curve-13.png
512
1024
Editorial Staff
https://pioneerinstitute.org/wp-content/uploads/logo_440x96.png
Editorial Staff2020-05-26 06:37:302021-01-28 14:09:31Survey Suggests Demand for Telecommuting After COVID-19 Crisis
https://pioneerinstitute.org/wp-content/uploads/The-Learning-Curve-13.png
512
1024
Editorial Staff
https://pioneerinstitute.org/wp-content/uploads/logo_440x96.png
Editorial Staff2020-05-26 06:37:302021-01-28 14:09:31Survey Suggests Demand for Telecommuting After COVID-19 Crisis https://pioneerinstitute.org/wp-content/uploads/CR_Auburndale_2019-4189.jpg
1332
1999
Mary Connaughton
https://pioneerinstitute.org/wp-content/uploads/logo_440x96.png
Mary Connaughton2020-05-26 06:14:522020-05-26 06:14:52It’s Time for the MBTA to Actively Engage Riders to Understand Their Commuting Plans
https://pioneerinstitute.org/wp-content/uploads/CR_Auburndale_2019-4189.jpg
1332
1999
Mary Connaughton
https://pioneerinstitute.org/wp-content/uploads/logo_440x96.png
Mary Connaughton2020-05-26 06:14:522020-05-26 06:14:52It’s Time for the MBTA to Actively Engage Riders to Understand Their Commuting Plans https://pioneerinstitute.org/wp-content/uploads/photo-of-abandoned-shopping-cart-on-grass-3283451-scaled.jpg
2389
2560
Andrew Mikula
https://pioneerinstitute.org/wp-content/uploads/logo_440x96.png
Andrew Mikula2020-05-22 13:16:262020-05-25 11:16:50Today’s Bureau of Labor Statistics estimate of a 15.1 percent unemployment rate in April only reflects half of Massachusetts’ COVID-19 unemployment surge
https://pioneerinstitute.org/wp-content/uploads/photo-of-abandoned-shopping-cart-on-grass-3283451-scaled.jpg
2389
2560
Andrew Mikula
https://pioneerinstitute.org/wp-content/uploads/logo_440x96.png
Andrew Mikula2020-05-22 13:16:262020-05-25 11:16:50Today’s Bureau of Labor Statistics estimate of a 15.1 percent unemployment rate in April only reflects half of Massachusetts’ COVID-19 unemployment surge
