
Education spending influences demographic trends at even the smallest scale
The Metropolitan Area Planning Council has a habit of solving identity crises for Massachusetts towns. Operating chiefly in Greater Boston, the MAPC uses 5 broad “community types” (and 9 subtypes) to classify municipalities statewide based on criteria such as housing density, proximity to Boston, historical character, and capacity to develop further.
All of this information is readily visible on Pioneer Institute’s MassAnalysis database, which provides an interactive map of the MAPC community subtypes under the Metrics tab (Figure 1).
Figure 1:
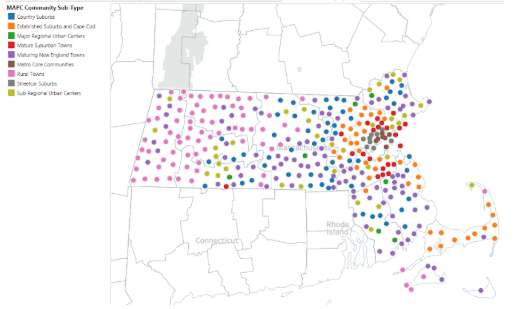
The type “inner core,” further divided into “metropolitan core communities” and “streetcar suburbs” is the only MAPC community type that is geographically contiguous. That is, inner core communities are always adjacent to at least one other inner core community.
Despite this high degree of interconnection, there’s one important metric that divides these two community subtypes: demographic trends. Specifically, concentrations of school-aged children have generally increased recently in the most populous streetcar suburbs (Arlington, Brookline, and Newton) and decreased in the largest urban core cities (Boston, Cambridge, and Somerville) (Figure 2). These trends can probably be explained by the migration patterns of both young professionals relocating for work and Baby Boomers looking to downsize. By the time these young professionals have kids, they often relocate to less densely populated communities, reinforcing the increasing concentration of school-aged children in inner suburbs.
Figure 2:
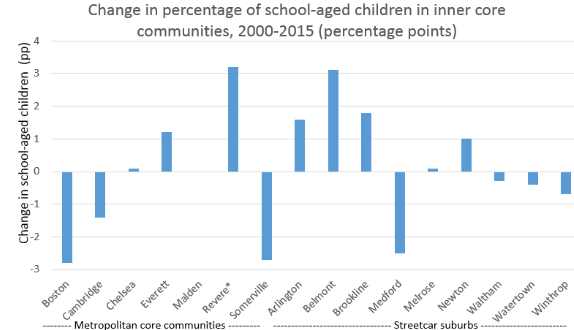
*Due to an error in the data, the percentage point difference in school-aged children is calculated for 2001-2015 for Revere, not 2000-2015
Despite a resurgence in demand for residence in urban centers since the early 1990s, it seems that Millennials still want to settle in the suburbs. While lower densities and lower crime rates are both appealing for new parents, industry reports indicate that the quality of a school district is a more important factor in people aged 37 or younger than it is in any other age group.
Overall, communities that increased per capita education spending between 2000 and 2015 tended to see a larger concentration of student-aged children by 2015 (Figure 3). The relationship has a moderately strong .60 correlation coefficient. A possible explanation for this trend is that young families are choosing to move to communities that had previously made momentous investments in education. In diverse communities such as Revere and Everett, immigration is likely also a factor, especially when municipalities invest in bilingual programs and other resources for immigrants and minorities.
Figure 3:

That said, the directionality of this relationship is not clear. Changes in education spending could simply reflect changes in community demographics brought about by immigration, population aging, and other factors. In other words, the concentration of school-aged children may predict budgetary conditions better than budgetary conditions predict the concentration of school-aged children.
As Millennials continue to become parents at a rapid rate, settlement trends and the factors that drive them will continue to be of interest to policymakers looking to improve the efficiency of education spending. Find out more about fiscal policy’s relationship with demographic trends by visiting Pioneer Institute’s MassAnalysis database.
Andrew Mikula is the Roger Perry Government Transparency intern at Pioneer Institute. He studies economics at Bates College.

