Health Care in the Mid-terms: What the Polls really tell us
Trying to read the tea leaves of poll numbers on the general public’s opinion of Obamacare has been especially confusing this election cycle. Either 70% still want a public option or 70% deride Obamacare. Pundits gladly spin these numbers in support of their viewpoint, but could there be truth hidden in the seemingly contradictory numbers. An interesting article written by Robert Blendon and John Benson in The New England Journal of Medicine last week tried to uncover some of the nuance.

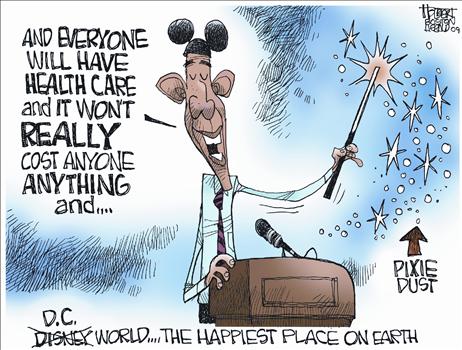
Source: Holbert, Boston Herald 2009
Some of the more interesting numbers presented:
- “18% of registered voters believed that Congress should implement the bill as it currently stands, 31% thought Congress should make additional changes to increase the government’s involvement… and 41% believed that Congress should repeal most of the major provisions of the bill and replace them…”
- “Majority (56%) of [the] public said they had just a little confidence or no confidence at all” that government could help solve health care problems.
- Only 9% of those intending to vote for a Democratic candidate believe that the bill will make the economy worse off, 39% say it will make things better. Not surprisingly, 75% of those voting for a Republican candidate think things will be worse.
- Only 27% of registered voters voting for a Democratic candidate want the current law to be implemented.
- Small business tax credits to help with health insurance costs are more popular (90%) than the expansion of the Medicare prescription-drug benefit (79%), or coverage for preexisting conditions.
Two major story lines emerge. One, that the law is in fact very unpopular. Second, however is that some of those who are upset are liberals wanting greater government involvement. Nonetheless, for context, 31% does not seem that far off from Gallup survey data in which 39% of Democrats identified as liberal. No matter how you cut it, the public does not like the bill, hence the lack of enthusiasm on the campaign trail to defend it. (A topic I have blogged on previously.)
So what does this all mean on election eve? I give the last word to data released today by Rasmussen Reports, given their focus on likely voters as opposed to just registered voters or a random sample of the general population.
58% of Likely voters favor repeal of the measure, including 45% who Strongly Favor it. That’s the highest overall level of support for repeal since mid-September.
36% of voters oppose repeal of the health care law, with 27% who are Strongly Opposed.

