MBTA Exhibits Worrying Vehicle Revenue Miles Trend
Along with Philadelphia’s Southeastern Pennsylvania Transportation Authority (SEPTA), the T is the only other US transit agency that operates all five major types of terrestrial mass transit vehicles: light rail vehicles (the Ashmont-Mattapan High Speed and Green Lines); heavy rail trains (the Blue, Orange, and Red Lines); regional rail trains (the commuter rail); electric trolleybuses (the Silver Line); and motor buses (MBTA Bus). Therefore, the T has an enormous responsibility to the public as a vast amount of commuters rely on it on a daily basis. Given its vast network, the MBTA is and should remain under constant scrutiny.
A vehicle revenue mile is defined as one vehicle traveling one mile with revenue passengers are on board, and is one of the most effective metrics when evaluating a public transportation system. When used to evaluate the MBTA’s five major types of terrestrial mass transit vehicles, the vehicle revenue mile reveals some potentially worrying trends. In fact, between 2007 and 2017 none of the five major types of mass transit vehicles showed considerable growth in vehicle revenue miles. The explanation for this decline is the agency’s inability to effectively roll out its capital projects program, although there has been improvement as of late.
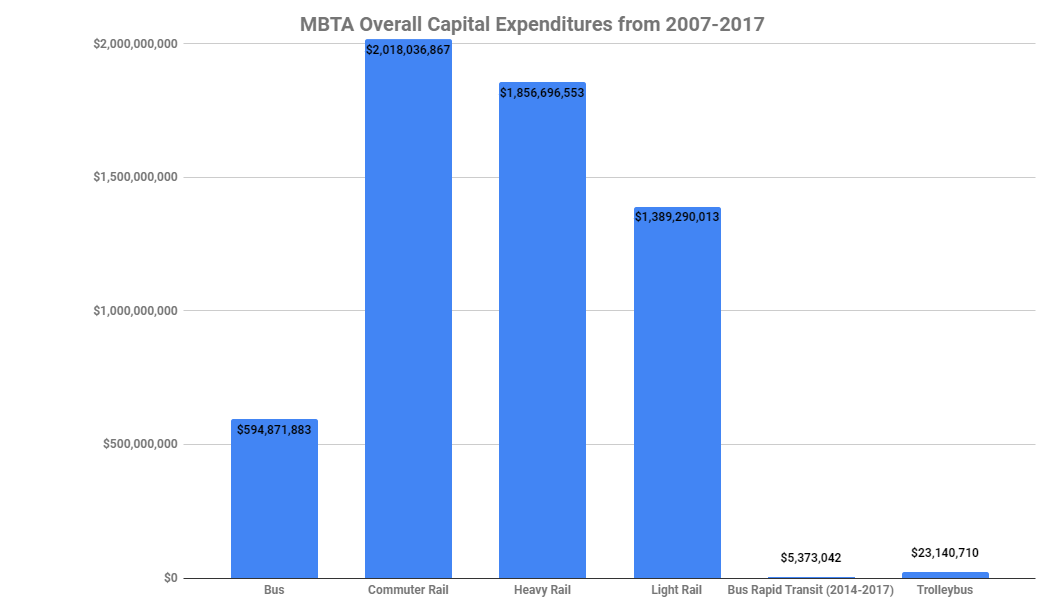
According to Pioneer Institute’s MBTAAnalysis.org, which includes data from the US Department of Transportation, despite overall operating expense increases for the five major transportation modes of $469,957,884 between 2007 and 2017, overall capital expenditures increased by only $229,203,514. Furthermore, capital expenditures for MBTA’s bus, heavy rail, and bus rapid transit programs decreased over this time period. Despite the MBTA’s bus program having the largest operating expenditures of any of the transportation modes from 2007-2017, it ranked behind commuter, heavy, and light rails in total capital expenditures.
To provide a strong public transportation system, the MBTA must review internal processes and talent and make the needed improvements on capital project delivery.
Only two transit modes, commuter rail and light rail, increased or maintained revenue per vehicle revenue mile between 2007 and 2017. In both cases, the capital expenditures were far greater than for the other modes of transportation. The commuter rail’s increase in capital expenditures of $151,955,303 nearly equaled its rise in operating expenses of $171,526,586, and the increase in the light rail’s capital expenditures of $139,535,007 outpaced its growth in operating expenses of $93,901,123 between 2007-2017.
While based on the data it appears unrealistic for capital expenditures to outpace or equal total operating expenses overall in the long term, a key to increasing revenue per vehicle revenue mile is closing the more than seven billion dollar gap that exists between the two. In fact, an increase in capital expenditures may not only increase the income per vehicle revenue mile, but could also lead to a decrease in operating expenses and an increase in ridership, which has been diminishing in recent years.
A key to recapturing the commuters who have opted for rideshare companies in recent years lies in reducing the capital expenditures gap.

