
MassAnalysis: Highest income towns per capita within average debt range or higher
Understanding debt limits
Municipalities issue debt to fund long-term capital projects such as schools and other buildings. In well-run communities, bond terms align with the lives of the capital assets being funded, a practice that provides resources for future projects. Paying debt service on assets long out of use can have dire financial consequences.
So who decides when bonds should be issued?
Cities, towns, and special purpose districts may authorize indebtedness by a two-thirds vote of their respective legislative bodies. A municipality’s statutory debt limit is based on equalized valuations (EQV). The EQV represents the estimated value of all taxable property in each municipality, an amount that is regulated and reviewed every three years by the Commonwealth’s Bureau of Local Assessment. Municipalities with total debt of over 5 percent of EVQ must seek further approval.
According to the Massachusetts Department of Revenue, “MGL c. 44 sec. 10 requires that debt authorized by cities and towns under certain sections of the law, primarily MGL c. 44, sec., cannot be authorized in total in excess of 5 percent of their most recent Equalized Valuation (EQV) or in excess of 10 percent of the EQV if approved by the Commonwealth of Massachusetts Municipal Finance Oversight Board (MFOB). The state auditor, state treasurer, attorney general, and the director for the Department of Revenue all serve as board members.
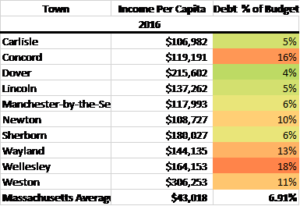
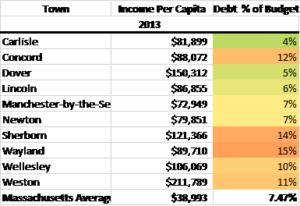
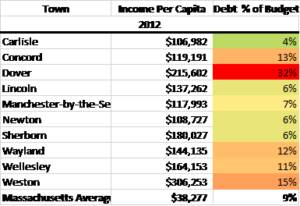
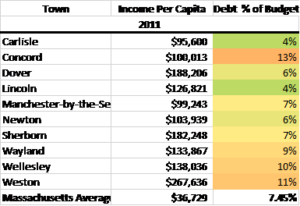
Debt service for some of the state’s wealthiest communities often exceeds the state average as a percentage of budget
Many communities set limits on debt service measured as a percentage of budget as a matter of fiscal restraint. Yet, some of the state’s wealthiest towns have relatively high debt service and amounts were found to vary dramatically from year to year. We selected the 10 most affluent communities based on income per capita and compared their debt service as a percent of budget to the state average.
Source: MassAnalysis

Source: MassAnalysis

Source: MassAnalysis
Source: MassAnalysis
Source: MassAnalysis
Source: MassAnalysis

Source: MassAnalysis
The Massachusetts average is based on all 351 municipalities’ debt as a percentage of budget for the fiscal year.
The data indicate that some wealthy municipalities have debt service levels that are at least twice the state average. For instance, in 2016, the state average was 6.91 percent and Wellesley and Concord were twice that amount. In 2010, the data tell a different story – none of the 10 wealthiest towns had debt serve twice the state average.
From 2010 to 2016, Lincoln was the outlier among these municipalities, remaining below the state average. Concord and Weston were the two municipalities whose debt service as a percent of budget remained greater than the Massachusetts municipal average.
To learn how community fares, be sure to regularly check MassAnalysis.
Madeleine Cammarano is a Roger Perry Transparency Intern for Pioneer and recently graduated from the University of New Hampshire at Durham with a degree in political science.

