
GDP by Industry: Middlesex County v. Suffolk County
Of all Massachusetts counties, Middlesex and Suffolk by far contributed the most to the state’s gross domestic product (GDP) in 2021. However, the two differed in terms of which industries were most instrumental to their disproportionate share of economic activity.
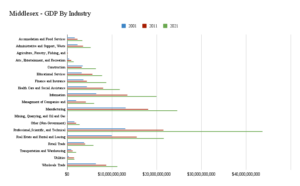
Fig. 1. Source: MassEconomix.
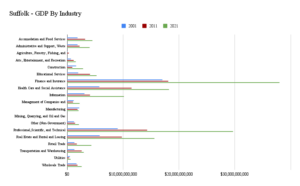
Fig. 2. Source: MassEconomix.
Valued at $184.2 billion, Middlesex County had the largest GDP in Massachusetts. Suffolk county was second with $146.6 billion. Just under half (48.8 percent) of Middlesex County’s contribution to the state GDP could be attributed to the top three industries in the area, while 58.6 percent of Suffolk County’s GDP share were attributable to its top three industries.
In Middlesex, the top three industries were professional, scientific, and technical services; manufacturing; and real estate, rental and leasing. Meanwhile, the biggest contributors to Suffolk County’s GDP were finance and insurance; professional, scientific, and technical services; and health care and social assistance.
Evidently, Middlesex County had a larger blue collar presence than Suffolk County did in 2021, as can be discerned from the fact that Middlesex had more GDP contribution from agricultural, construction, manufacturing, and mining industries than Suffolk. Further, while both counties have prevalent professional, technical, and scientific services industries, Middlesex contributed far more to the Massachusetts GDP via this category. Suffolk County significantly outperformed Middlesex county’s GDP share in both the finance and insurance industry and in health care and social assistance.
In the last two decades, both counties have seen different trends in industry growth, as can be observed in the disparities in GDP share per industry among them.
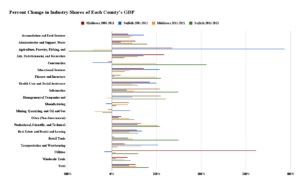
Fig. 3. Source: MassEconomix.
As illustrated in Figure 3, Suffolk county saw a substantial increase of 387 percent in GDP via their agriculture, forestry, fishing, and hunting industry from 2001 to 2011, then saw a large decrease of 97 percent from 2011 to 2021. Other large trends include Suffolk’s 212 percent increase in GDP via the construction industry from 2011 to 2021, with a 149 percent increase in the retail trade share of their GDP in the same time frame.
Meanwhile, Middlesex county saw a 323 percent increase in GDP attributed to the utilities industry between 2001 and 2011. Both counties experienced trends of significant increases in the share of GDP via the finance and insurance industry from 2011 to 2021, with Middlesex having a 99 percent increase and Suffolk a 110 percent increase.
These industries not only contribute greatly to each county’s GDP, but they also keep many employed and well paid. The average weekly wages in 2021 for Middlesex County’s top three industries were $2,571 for those in the professional, scientific, and technical services industry; $2,013 for those in manufacturing, and $1,577 for those in real estate. In Suffolk County, those in the finance and insurance industry earned a weekly average of $2,521, while those in professional, scientific, and technical services earned $2,106; and healthcare workers earned $1,036.
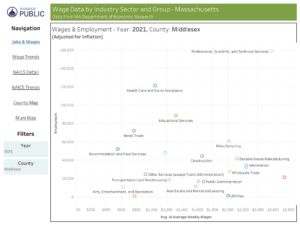
Fig. 4. Source: MassEconomix.
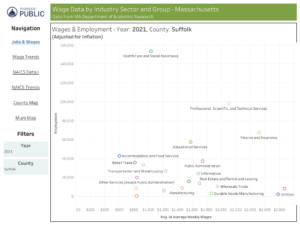
Fig. 5. Source: MassEconomix.
However, none of the aforementioned industries were the top earners in either county. Instead, both counties’ top earners were in managing companies, where the average worker earned a weekly wage of $2,747 in Middlesex County and $2,872 in Suffolk County.
About the Author: Sarah Delano is a Roger Perry Government Transparency Intern at the Pioneer Institute for the summer of 2023. She is a senior studying Political Science at the University of Massachusetts-Amherst.

