
How do employment trends differ between urban and rural Massachusetts from 1999-2019?
In 2018, one in five Americans lived in rural towns across the country, generating 10% of Gross Domestic Product. In Massachusetts, rural workers, on average, earned 71% of those in urban areas. However, in 2015, the percentage of people living below the poverty threshold was only three points lower in rural areas than urban. To better understand these statistics, data available on employment across Massachusetts counties is helpful. This blog will investigate the employment trends in Franklin and Middlesex Counties from 1999-2019.
As of 2019, total population in Franklin and Middlesex counties was 70,180 and 1,611,699, respectively. It is worth noting that there are still some rural parts of Middlesex (Ashby, for example). However, Middlesex County has significantly more urban areas than Franklin. Comparing these two counties will inform our understanding of the employment trends between urban and rural counties to some extent.
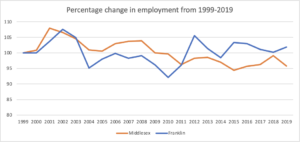
This image depicts the percentage change in employment in both Franklin and Middlesex counties from 1999-2019. (Source: Pioneer Institute, MassEconomix)
The graph above shows that employment grew by 0.14% in Franklin County from 1999-2019, whereas it declined by 4.17% in Middlesex County for the same time period. Notably, Middlesex County began with significantly more employed people (approximately 925,346 in 1999) than Franklin County (32,643 in 1999). Therefore, a slight increase in the number of employed people is enough to increase Franklin’s percentage significantly. Relying on just the rates might distort the data. Investigating other factors will provide a more nuanced perspective.
Investigating how the median household income of the two counties has changed in the past two decades provides a different picture. The graph below shows that, as of 2019, median household income in Middlesex County is $100,517, compared to Franklin county at $59,522. Statewide, median household income was $66,866. Economic growth in Franklin County lagged the state and Middlesex. But what may be the reasons?
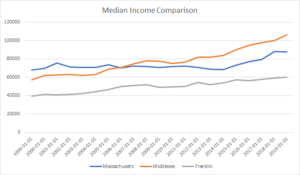
Median household income comparison between the Counties of Middlesex and Franklin to the state of Massachusetts (Source: Data USA)
The aging population is perceived to be a fundamental reason for declining economic opportunities in rural areas across the United States. But does this hold for Franklin County?
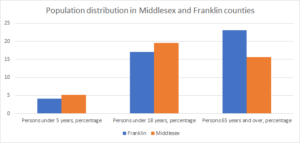
The figure shows that Franklin County has a higher percentage of dependent population groups than Middlesex County (Source: US Census Bureau).
A larger number of dependents (i.e., persons under 5 years and persons above 65 years and over) means that the number of working-age adults is relatively small. This reduces the number of workers in relation to the population needing support. As a result, both median household income and household savings drop.
It is essential to contemplate ways to combat this economic deprivation. In 2019, the Rural Policy Advisory Commission (RPAC) introduced policies intended to bring economic development to rural Massachusetts, focusing on Franklin County. These policies include providing monetary and professional help to small rural businesses. Additionally, RPAC focuses on funding farmers and enacting a Rural Jobs Act to help small businesses expand and create jobs by providing access to capital.
It is yet to be determined whether these policy initiatives were strong enough to jumpstart economic growth.
We do not know whether the “rural decline, urban renaissance” narrative holds true for all counties of Massachusetts. However, from comparisons between the number of employees, median income, and population ratios, it can be argued that Middlesex County is economically better off than Franklin County.
Maida Raza is a rising Senior at Earlham College. She is pursuing a Bachelors’s in Economics and Mathematics. Maida is working as a MassEconomix Intern at Pioneer Institute.

