
State Employee Labor Force Vs State Revenue Growth: Are They Related?
State jobs represent a significant amount of the labor pool in Massachusetts. In 2022, the state employed 85,634 workers. Massachusetts total state revenue has consistently increased over the last 10 years, but did the growth correlate to a spike in state jobs?
In 2010, total state revenue was just over $70 billion growing to $122 billion in 2022. When taking inflation into account, that’s an almost 27% increase.
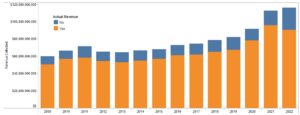
Figure 1: Source: MassOpenBooks (2009 – 2022)
(yes representing usable revenue and no representing non usable revenue)
In 2010 there were 74,021 state employees growing to 85,634 employees in 2022, an increase of 15.7% (Figure 2). Between 2020 and 2021 Massachusetts saw an $11 billion increase in total state revenue. Factoring in inflation, that amounts to a 21.6% increase. Much of the growth was likely due to federal COVID relief funds. From 2020 to 2021 state employment varied little, likely due to the pandemic restrictions.
But even with 2020 to 2021 as an outlier, a spike in state employment during the year 2016-2017 which saw an increase in employees from 75,093 to 80,719 doesn’t correlate to an increase in revenue during the same period. In fact, annual revenue was close to flat. This would suggest that there is no direct correlation between total state revenue and the amount of state employees.
Is the same true for state employee salaries?
State employee salaries have steadily increased in recent years. Since 2010, there has been a reasonably steady increase in the average salaries of state employees, growing from $51,200 in 2010 to $77,922 in 2023 overall and overall growth of 52%. However, when taking into account inflation we find the true increase in state employees salaries is just 7.25%. Although this is a much lower rate than the inflation-adjusted 27% increase in total state revenue, there is somewhat of a correlation.
Moreover, when comparing the parallels between annual state revenue and state employee salaries there is less consistency. For instance, revenue growth from 2017 to 2018 represented a 2.47% inflation-adjusted increase, growing from $79.4 billion to $83.7 billion. Conversely, state employee average salary increased 4.9 when considering inflation, growing from 61,805 to 66,677.
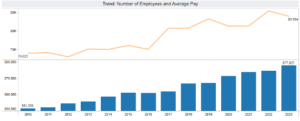
Figure 2: MassOpenBooks (2010,2022)
(Top half of graph representing amount of employees and bottom representing average salary)
As state revenue increased both the amount of state employees and their salaries increased. However, when looking at each individual year there does not appear to be a direct relationship between the amount of state employees/state employee salaries and the total state revenue. There are a number of factors that determine the amount of state employees and the amount state employees get paid.
About the author: Axel Portnoy is a Roger Perry Transparency Intern at Pioneer Institute for the summer of 2024. He is a rising senior at Milton Academy.

