Let Me (Try to) Explain — Property Tax Increases
(Blog series so named for William Bulger’s admonition about the three most deadly words a politician can say: Let me explain.)
The gubernatorial candidates are sniping at each other over property tax issues. And Blue Mass Group poster “JohnK” has weighed in with a measured assessment of the claims and counterclaims, entitled “CHARLIEBAKERFAIL” or some such thing (they must be using a template at this point).
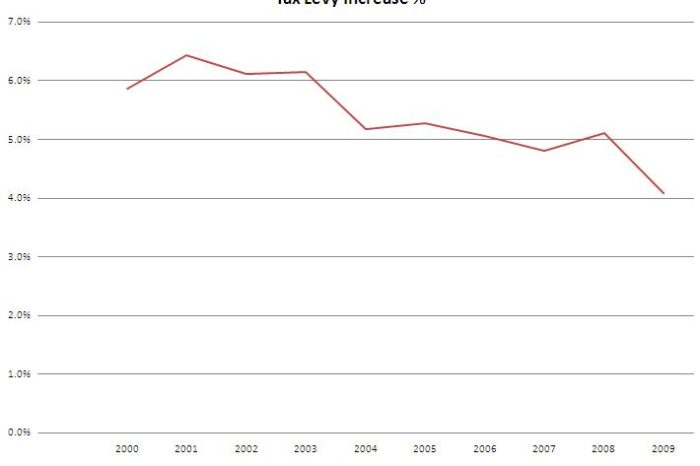
The latest salvo comes from the Patrick Campaign, which is trying a very delicate semantic pivot — that property tax increases have decreased under the GOV.
They put up this chart, which I can’t recreate. But from this DOR data, I get directionally the same results. (I’d note that I’m using “Total Tax Levy” to determine increases, if I’ve made an error using this, I hope someone sets me straight.)
One thing, I’d note is that the take from property taxes comes from two sources — existing properties and new growth. If the ‘decrease in the increase’ came from a slowdown in new growth, that’s not a good thing.
I grabbed a spreadsheet off of DOR’s website that tracks the role of new growth in the property tax base.
What you see is that taxable new growth (the blue line) has tailed off in the past few years. No surprise right? Homebuilding and commercial property development have taken it on the chin in this recession.
What you also see is that with an existing tax base growing inexorably at something close to 2.5%, even consistent levels of new growth in nominal dollars (never mind decreases) have less and less of an impact on property tax growth rates. (The red line is amount of new growth applied to tax base as a percentage of previous year’s levy limit)
So, the big takeaway? I’d be hesitant to take credit for a decline in property tax increases if the driver was a lack of growth and not relief for the average homeowner.


