For many years, a few hospitals have dominated the Massachusetts hospital market in terms of total patient revenue and net patient commercial revenue. The relative size of revenue among hospitals is important to understanding the relationship between hospitals and their payers.
We obtained “commercial revenue” data, which is the total net patient revenue that hospitals collect from employers that are self-insured, fully insured from commercial insurance, and individual payers for both commercial managed and non-managed care. This metric does is not include revenue from state or federal government sources.
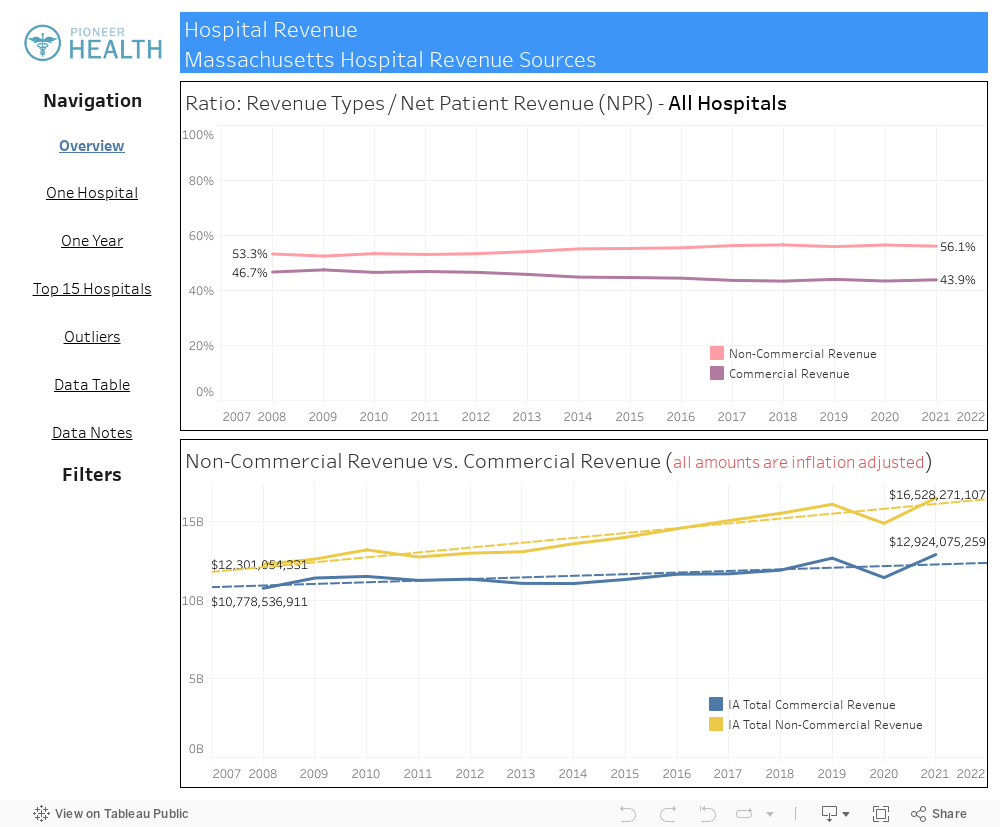
Over these past 13 years, payments by the non-commercial (public payer) sector have gradually grown higher than payments by the commercial sector. In 2021, for all hospitals, the non-commercial (public payer) sector accounts for 56.1% of total patient revenue, while the commercial sector accounts for 43.9%.
From 2008-2021 of the top 15 hospitals by net patient commercial revenue, there has been a group of hospitals that, consistently, have the highest levels of commercial revenue. The group is as follows: Boston Children’s, Dana-Farber Cancer Institute, Newton Wellesley Hospital, Brigham and Women’s, and Massachusetts General Hospital. Using the Pioneer MA Hospital Relative Price Tracker, we also see that the top five institutions in Massachusetts with the highest prices are Boston Children’s, Dana-Farber, Brigham and Women’s and Massachusetts General Hospital. Comparing the two groups, we see that almost the same five hospitals with the highest commercial revenue are those that also have the highest relative commercial prices.
The group of hospitals with the lowest commercial revenue has varied a bit more throughout the given time-period. However, some of the consistent contenders are Shriners Hospital, Athol Memorial Hospital, Steward Norwood Hospital, Anna Jaques Hospital, and Falmouth Hospital.
We can use this tool to better understand revenue trends in the Massachusetts hospital market, and the shift in revenues from the commercial to the non-commercial or public payer sectors.