
Puzzling “Relationship” Between Police Expenses and Crime Rates in Middlesex County
It may seem safe to assume that the more well-funded a town’s police department is, the better equipped that town is to combat crime. In smaller towns and suburbs where crime may not be rampant, one would therefore expect crime levels to have an inverse relationship to police funding. However, using Pioneer Institute’s MassAnalysis transparency tool, a clear relationship between police expenses and crime rates in the mature suburban towns in Middlesex County can be called into question.
Seven Middlesex County towns are considered to be “mature suburban towns”: Reading, Burlington, Wakefield, Stoneham, Winchester, Maynard, and Natick. At $352 per capita, Burlington spent the most on police in 2022. Reading spent the second most at $272 per capita, while Natick spent the least at $208 per capita. The average per capita police department expenses for these towns in 2022 was $253. Burlington, Reading, and Winchester all spent more than this average, while Natick, Stoneham, Maynard, and Wakefield spent less.
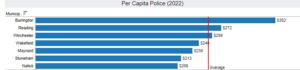
Figure 1. Mass Analysis
Based on these data, it may seem logical to assume that since Burlington and Reading have higher per capita police expenditures, they must have the lowest crime rates. One might also expect Natick and Stoneham to have the highest crime rates. But the crime rate data in some of these Middlesex County towns is quite puzzling when examining it alongside police expenditure data.
Despite spending the most on policing, Burlington had the highest rate of property crime in 2022, twice as high as Stoneham’s. Burlington also had the highest rate of motor vehicle theft, with a rate that was about four times higher than Natick’s. Additionally, Reading had a burglary rate that was about three times higher than Winchester’s.

Figure 2. Mass Analysis

Figure 3. Mass Analysis
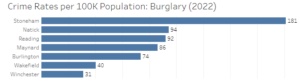
Figure 4. Mass Analysis
In some towns there appears to be a correlation between crime rates and police expenditures. While Reading’s 2022 burglary rate ranking was surprising, Stoneham and Natick, with the lowest per capita police expenses, had the two highest rates. Furthermore, despite Burlington placing at the top of the list for motor vehicle theft, Reading and Winchester’s rates were the lowest by a wide margin.
There is also interesting data on violent crime. There seems to be a stronger correlation between police funding and crime rates in this category. Reading, Winchester, and Burlington, the three towns out of the seven that spent more than the per capita average for police, had the lowest rates of violent crime. But Burlington’s rate was about eight-and-a-half times higher than Reading’s, despite their margin in police expenses per capita being the greatest among towns ranked sequentially in this group.

Figure 5. Mass Analysis
It is clear that police expenditures are not the only driving force behind the crime rates in Middlesex County’s mature suburban towns. While these data are only from one year and in towns where crime is not considered a huge problem, the mismatch between police expense rankings and crime rate rankings for these towns show that other factors are at play in dictating a town’s crime rates. These data can be connected to other studies that challenge a correlation between police funding and crime rates throughout the country. While funding is important for a police department, considerations outside the realm of finances must be taken into account by policymakers when addressing crime.
About the Author
Matt Mulvey is a Roger Perry Transparency Intern at the Pioneer Institute. He is a rising senior at Swarthmore College where he is a political science major and history minor.

