
How Has Employment Changed In Massachusetts?
In 2013, 60.1 percent of the civilian non-institutional population (people over 16 who are not in active duty) in Massachusetts was employed, growing to 62.9 percent in 2023, Even with COVID’s effect on employment from 2019 to 2022, employment rates have increased over the last decade.
Looking at employment trends provided by Pioneer’s website under Labor Analytics, it is evident that even though overall employment has risen , 20-24 and 16-19 years-olds are working less , while older generations are working more.
For example, in 2007 69 percent of those ages 20-24 in Massachusetts were employed, and in 2023 only 61 percent of 20-24 year olds in Massachusetts were employed. Furthermore, for those aged between 16-19, employment has decreased from 38 percent in 2007 to 34 percent in 2023.
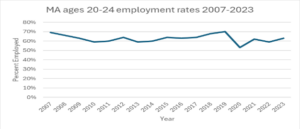
Figure 1: US Labor Market (2007-2023)
(Showcasing the change in employment in Massachusetts from 2007-2023 for ages 20-24)
Moreover, in 2007, 67 percent of Massachusetts residents aged 55-64 were employed, and in 2023, 72 percent of those aged 55-64 in Massachusetts were employed. For individuals aged 65+, employment rates also increased from 15 percent in 2007 to 22 percent in 2023.
The COVID effect is difficult to measure. In 2015 employment rates were already down significantly:64 percent of individuals aged 20-24 were employed – a 5 percent decrease from 2007.
Furthermore, when looking at the gross number of people employed by age group in Massachusetts, there are significantly more 55-64 year old’s and individuals 65+ who are working than those 16-19 years old and 20-24 years old. There are 678,000 people in the 55-64 age group employed while there are only 326,000 people in the 20-24 age group. Additionally, there are 274,000 people 65 and over who are employed, compared to only 129,000 people in the 16-19 age group. This means that the 5 percent increase in employment for 55-64 year old’s is much more significant as a gross number than the 5 percent decrease in employment for ages 20-24.
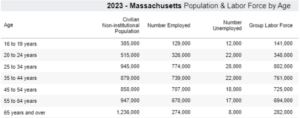
Figure 2: US Labor Market (2023)
The decrease in the percentage of younger people who are employed may be due to a number of factors. For example, it may be that with the technological advancements in recent years, many entry-level jobs have been replaced by technology, making it more difficult for the younger generation to get jobs.
Furthermore, the rising percentage of older people working suggests that people are having a harder time retiring and that after many years of employment, those aged 65+ don’t have enough money saved up. This too may be due to a number of factors. For example, it may be that the increase in cost of living in Massachusetts has made it more difficult for people to retire.
In conclusion, even though employment rates as a whole have increased in Massachusetts, younger residents are working less and older residents are working more. This suggests that the older generation is working longer, leaving younger workers with fewer entry-level jobs. However, it is also possible that there’s been a cultural shift in work values between the younger generation and the older generation.
About the Author: Axel Portnoy is a Roger Perry Transparency Intern at Pioneer Institute for the summer of 2024. He is a rising senior at Milton Academy.

