
How Does Police Funding Affect Property Crime?
Since 2017, crime rates in Massachusetts have varied significantly by municipality. In some towns, crime has increased significantly, while in others it has dropped. When looking at property crime rates, the data has fluctuated greatly between 2017 and 2022.
In municipalities such as Cambridge, Hadley, and Seekonk property crime rates have significantly increased. For example, Cambridge had 2,031 property crimes in 2017 and in 2022 there were 2,622. Furthermore, Cambridge’s property crime occurrences per 100,000 people increased from 1,818 in 2017 to 2,240 in 2022. Moreover, Hadley went from 2,490 property crime occurrences per 100,000 people in 2017 to 3,509 property crime occurrences per 100,000 people in 2022. Seekonk’s property crime occurrences per 100,000 also increased significantly from 1701 occurrences to 1,918 occurrences.
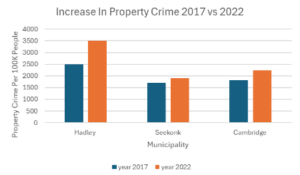
Figure 1: MassAnalysis (2017, 2022)
Then there are other municipalities where property crime decreased significantly, such as Holyoke, Springfield and New Bedford, where property crime all decreased. Holyoke property crime occurrences per 100,000 people decreased from 4,811 in 2017 to 3,719 in 2022. In New Bedford, property crimes per 100,000 people decreased from 2,857 in 2017 to 1,560 in 2022. Lastly, property crimes per 100,000 people in Springfield have decreased from 2,972 occurrences in 2017 to 2,370 in 2022.
There may be a variety of reasons for the extreme fluctuation in Massachusetts property crime. When looking at police funding changes from 2017 to 2022 in the three towns where property crime increased, per capita police expenditures rose in all those municipalities. In Cambridge, police funding per capita increased from $329 per capita to $405. In Hadley, it rose from $195 to $241. Lastly, per capita funding for police in Seekonk increased from $237 to $293.
Between 2017 and 2022, per capita police funding also rose in the three municipalities where property crime decreased.. For example, per capita police funding in Holyoke increased from $318 in 2017 to $328 in 2022. In New Bedford, it rose from $257 in 2017 to $313 in 2022. Per capita police funding in Springfield increased from $287 in 2017 to $385 in 2022.
For these six towns, there doesn’t appear to be a correlation between police spending and property crime rates. From this information we may infer that there are multiple factors in addition to police funding that affect the amount of property crime.
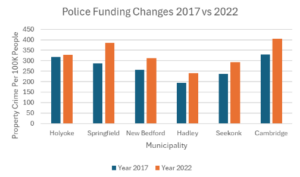
Figure 2: MassAnalysis (2017, 2022)
About the Author: Axel Portnoy is a Roger Perry Transparency Intern at Pioneer Institute for the summer of 2024. He is a rising senior at Milton Academy.

