The MBTA’s Escalating Operating Expenses
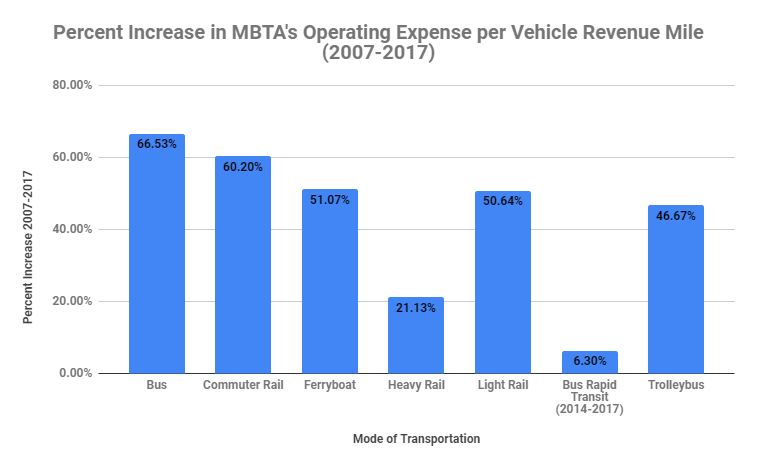
The MBTA experienced a significant increase in operating expenses per vehicle revenue mile between 2007 and 2017, according to Pioneer Institute’s MBTAAnalysis.com. During that period, total operating expenses per vehicle revenue mile for MBTA bus, commuter rail, ferryboat, heavy rail, light rail, and trolleybus service increased by an average of 49.31%. The most significant contributor to the increase was MBTA bus service, which experienced a nearly 67% increase in total operating expenses per vehicle revenue mile. In pure dollar terms, ferries experienced the greatest increase, with operating expenses per vehicle revenue mile increasing by $15.94 between 2007 and 2017, which was $5.31 more than the second biggest increase. Of the major modes of transportation, heavy rail experienced the smallest rise during the 10-year period with a 21.13% increase.
For many modes, operating expenses per vehicle revenue mile also increased in relation to MBTA peer transportation agencies. In fact, in 2017 the MBTA’s bus, commuter rail, heavy rail, bus rapid transit, and trolleybus programs had either the highest or second highest operating expenses per vehicle revenue mile when compared with peer transportation agencies around the country. While high costs are somewhat inevitable given the MBTA is one of the largest public transportation systems in the country, the peer agencies are similarly large.

