
Examining the Academic Achievement Decline in New England Prior to COVID-19
Recent declines in the performance of American public school students have largely been attributed to the effects of COVID-19. The data show that student achievement has deteriorated following the lockdowns, along with increases in chronic absences and the likelihood of students dropping out.
But the decline in student achievement did not begin when classrooms became virtual in the spring of 2020. There has been a very noticeable falloff in student achievement beginning in 2013. While this decline has occurred throughout the country, the degree to which student performance has suffered is especially evident in New England.
Using Pioneer Institute’s Mass Report Cards data tool, trends in student performance are apparent. The National Assessment for Educational Progress, also known as the Nation’s Report Card, measures the performance of a sampling of students across the country. Nationally, there is a dramatic deterioration in performance beginning in 2013.
As New England states, along with most others, adopted the Common Core curriculum in 2013, student performance began to decline. Each New England state was experiencing an improvement in 4th and 8th grade National Assessment of Educational Progress (NAEP) math scores until 2013. But between 2013 and 2019, the positive trend turned negative, as all New England states, outside of Connecticut, saw drops in student performance in both 4th and 8th grade math. While these declines were seen in regions throughout the country, the declines in New England were in fact more substantial than the rest of the country. The negative percent changes in New England states were among the biggest in the nation between 2013 and 2019.
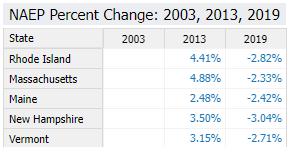
Figure 1. 8th grade math percent change in New England
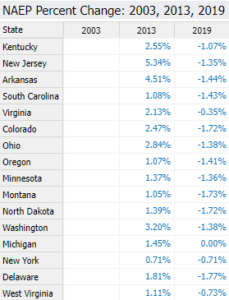
Figure 2. 8th grade math percent change in several other states
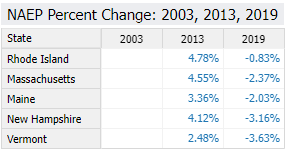
Figure 3. 4th grade math percent change in New England
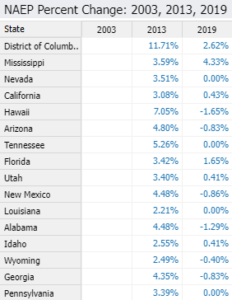
Figure 4. 4th grade math percent change in several other states
New England’s 8th grade math NAEP scores in 2013 averaged 292, which was well above the national average of 284. But by 2019, New England’s average dropped by seven points to 285. And while this was still above the national average for that year, the country as a whole only experienced a three point drop in its average to 281.
New England’s larger decrease was also evident in 4th grade math. The region’s 2013 average score of 247 fell to 242 in 2013. This five point drop was larger than that of the US as a whole, which fell from 242 to 240. Furthermore, New England experienced the greatest drop off of any individual region in the country in their 4th and 8th grade math scores. Their five point drop in 4th grade math and seven point drop in 8th grade math is greater than the drop-off experienced by any other region.
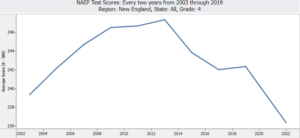
Figure 5. New England 4th grade math NAEP score graph
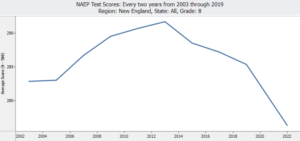
Figure 6. New England 8th grade math NAEP score graph
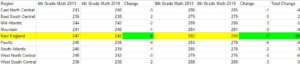
Figure 7. NAEP score drop-offs throughout all regions
The unfortunate reality is that U.S. student performance continues to decline. There were sharp drop-offs in NAEP scores following the lockdowns of 2020, and scores have continued to decline in the years following as students have been unable to recover.
But COVID is not the only culprit of the downward shift in student performance. The implementation of Common Core is clearly correlated to student performance declining, and the effects are greater in New England than in the rest of the country. Massachusetts still has the highest average math scores among all the states, but performance is clearly moving in the wrong direction in our state and the rest of the region.
About the Author
Matt Mulvey is a Roger Perry Transparency Intern at the Pioneer Institute. He is a rising senior at Swarthmore College where he is a political science major and history minor.

