The MassLottery: A Bay Stater’s Favorite Pastime
If there’s one game Massachusetts residents like to play, it’s the lottery. They spent $5.9 billion on lottery tickets and instant games in 2021, which made the lottery the fourth highest revenue source for the state that year. This is nothing new, as the lottery has consistently ranked among the top five sources of revenue since 2009. Figure 1 shows its consistent and considerable growth starting in 2011, with collections increasing 22 percent over 10 years.
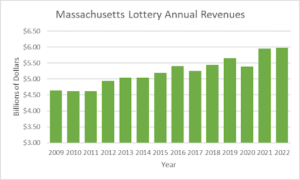
Figure 1: Revenues earned from the state lottery by year. Observe the nearly $1.5 billion increase from 2011 to 2021. Data is from Pioneer’s MassOpenBooks website.
The MassLottery: A National Exception
We can understand the true extent of Massachusetts’ lottery revenue when comparing it to other states. Figure 2 shows that, out of the 45 states with a lottery, Massachusetts ranked sixth in earnings for 2021. Revenues are comparable to Georgia and Ohio – states with 3-4 million more residents.
This confirms a long-term trend: Massachusetts has the nation’s highest per-capita lottery spending at $805.30, according to a recent study conducted by LendingTree. Compare this to the second-highest rate of $455.93 in New York and the national average of $223. Additionally, Massachusetts has the highest share of personal income spent on the lottery, at $10.26 per $1,000 – just under $2 more than the runner-up, Georgia.
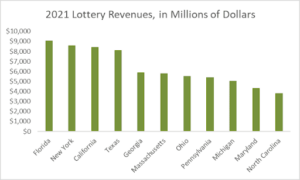
Figure 2: State lottery revenues for the top 10 highest earning states, in descending order. Data is from Statista. Notice how Massachusetts is the second lowest-population state in the top 10, while ranking a close sixth among much larger states.
Why Massachusetts Loves the Lottery
One possible explanation for why Massachusetts residents spend so much on the lottery is the payout. The same study reported that Massachusetts has the highest payout rate per capita, at $560.81. This results in a payout-per-dollar rate of $0.70: the second highest in the nation, narrowly trailing only Missouri. A high payout is attractive to players – while they might be spending a lot, there’s the opportunity to earn a lot as well.
In short, Massachusetts players take to heart the old adage that “you have to spend money to make money.” This is best reflected in the recent approval and rollout of a $50 scratch ticket this past February, offering $1 billion in total winnings and up to $25 million in instant winnings. The ticket was introduced due to “sustained customer requests,” according to Mass Lottery’s announcement, indicating not only a sustained increase in demand, but also a willingness to buy big.
A second reason is the economic situation that allows Bay Staters to play the numbers in this way. In the same LendingTree study, they found in their survey of American consumers that individuals earning between $75k-$90k annually have the highest proportion of lottery players, at 64 percent. Since the per capita income of Massachusetts residents has fallen within this range for years – it was $84,945 in 2022 – it only follows that Massachusettans would be more likely to play.
This may seem like an ideal situation: the state receives a large sum in non-tax income, and citizens get an exciting – and occasionally rewarding – pastime in return. However, this comes with substantial risk. The recent legalization of sports betting and the rise of casinos, give rise to a greater chance that residents may suffer the negatives of gambling: financial ruin, social calamity, psychological hardship, and addiction. Without proper care and attention from both players and commissioners, the proliferation of gambling could portend a dark path for many of the Commonwealth’s citizens.
Peter Mentekidis is a Roger Perry Transparency Intern with the Pioneer Institute. He is a rising senior at Providence College, with a major in Quantitative Economics and a minor in Philosophy. Feel free to contact via email, LinkedIn, or writing a letter to Pioneer’s office.

