Public Works Expenditures Across All 26 Gateway Cities
Using MassAnalysis.com, a free government transparency tool provided by Pioneer Institute, with a few clicks, a report was generated to compare 2016 public works expenditures across all 26 Gateway Cities in Massachusetts. The results are demonstrated in the chart below:
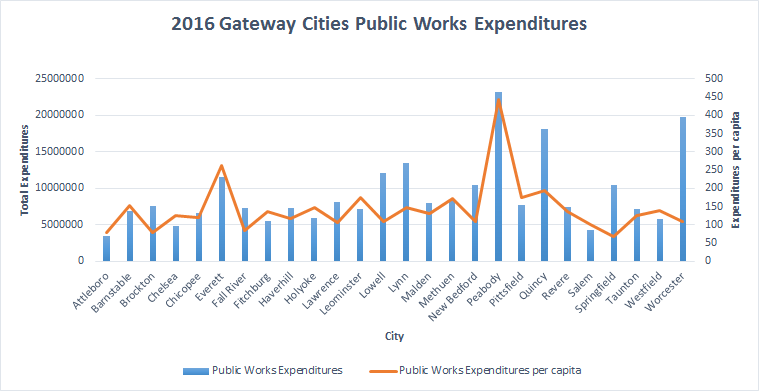
The findings were unexpected. Peabody is the 15th largest city, but had both the highest public works expenditures with costs amounting to $23,199,119 in total and $443 on a per capita basis. These costs are almost twice the amount of Everett, the city that has next highest costs per capita, which amount to $261.
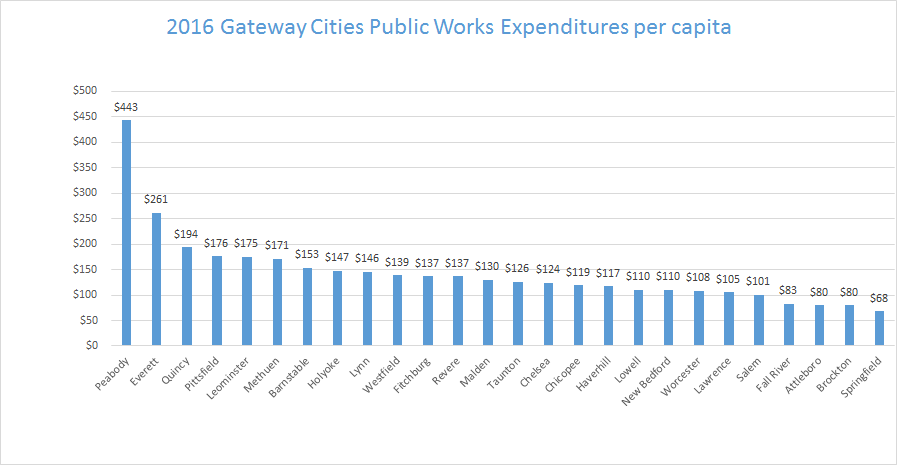
Worcester and Quincy had the 2nd and 3rd highest costs, $19,739,457 and $18,160,826, respectively. However, this can be explained by the size of the cities, Worcester is the largest of the Gateway Cities, while Quincy is the 6th largest. On a per capita basis, Worcester and Quincy’s public works costs amounted to $108 and $194, respectively.
Springfield had the lowest costs per capita, at $68, with total costs amounting to $10,448,433, the 8th highest of the cities. This is somewhat surprising, given that it is the 2nd largest Gateway City and the fourth largest city in New England.
Attleboro had the lowest total costs at $3,506,611, followed by Salem at $4,344,514. On a per capita basis, Attleboro was tied for the second lowest costs, at $80, while Salem had the fourth lowest costs, at $101. These two cities are almost identical to Peabody in terms of median household income and per capita income, and are relatively similar in terms of population (each has about 10,000 fewer residents than Peabody at 52,376, according to the 2012 census).
This makes Peabody’s unusually high public works expenditures all the more perplexing, given its similarities to the cities with two lowest expenditures.
An inquiry was placed with Peabody’s Department of Public Services, but Pioneer has not received a response to date. Certainly, Peabody’s spending on publics works warrants further investigation.
That being said, there will always be outliers in any data set. This is what makes transparency tools so great; they give citizens the opportunity to ask important questions they otherwise wouldn’t.
For more analysis of Massachusetts communities, visit MassAnalysis.com, where you can use our tools to benchmark how your city or town is doing across a number of different measures.

