A Public Transit that Neglects Its Public
Two of a community’s most important hubs are its colleges and hospitals. Higher education keeps a population vibrant and upwardly mobile, while access to health care keeps them well.
Pioneer Institute’s municipal website, MassAnalysis, classifies Lowell, Lawrence and New Bedford as peers based on population density and size. For these cities, each with over 20 percent of their populations living below the poverty line, public transit is a necessity. Yet the doesn’t even offer Sunday service.
In Lowell, service to these community hubs is significantly slower than in its peer cities. On average, the Lowell Regional Transit Authority’s (LRTA’s) service is 1.7 times slower than similar service in Lawrence and 1.2 times slower than in New Bedford.
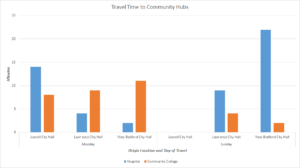
Source: maps.google.com. These figures were averaged between days and then locations by city to provide the aforementioned comparison for Lowell.
This is because its participating towns and cities pay the LRTA based on miles driven, not ridership statistics: “The city of Lowell and the Towns served by the LRTA buses pay an assessed amount, depending on the number of miles served in that city/town, and increases are capped at 2 1/2% per year.” (Source)
While the number of miles ridden has fluctuated, the number of miles offered via LRTA routes has consistently increased.
Source: Transit.DOT.gov
This has been directly reflected in the LRTA’s historic funding:
Source: Transit.DOT.gov
From 2012 to 2016, an increase in the miles provided/driven by LRTA’s buses corresponds to increased payments from served towns and cities (local assessments).This increase in funding is not a response to demand, because demand has fluctuated. Our previous graph showed a decrease in ridership from 2015 to 2016, despite higher local assessments. If demand isn’t growing but miles and funding are, it suggests that the LRTA is focusing more on their rides than their ridership.
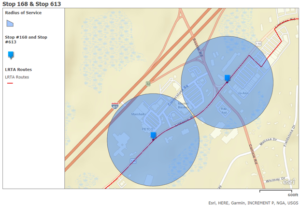
The LRTA is not serving its communities adequately. Pioneer Institute made the following interactive map to show you where people are, and where (instead) the LRTA decides to serve:
An example of the LRTA’s failure to serve its population is the distribution of stops along Route 15, which runs along Littleton Road until it reaches Technology Drive in Westford, MA. Here a significant density of businesses are served by a dismal two stops (stop #168 serves 47 businesses in an 854-foot radius; stop #613 serves 19 businesses within the same radius).
Technology Park, a 0.2 square mile series of business complexes, lies a mile east on Route 15. Rather than placing a stop on Littleton Road (forcing at most an eight-minute walk), 15 diverts onto Technology Park Drive and adds three stops. This diversion more than doubles the driving distance from 1,295 feet to 3,148 feet.
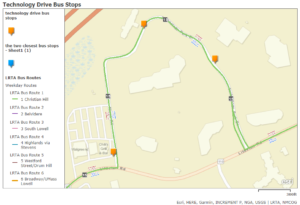
For Technology Park, each bus stop need only serve an average six businesses, whereas the aforementioned stops each have to accommodate an average of 33 businesses. The only gain from this rerouting is the aforementioned tripled service distance, which according to the LRTA would increase payments from towns and cities.
LRTA communities are connected to greater Boston via the Commuter Rail Lowell Line, and local buses accept MBTA Charlie Cards. LRTA stations even allow commuters to purchase Charlie Tickets for travel between the two systems.
Despite Lowell’s seamless transition for commuters, ridership has remained stagnant. In Lowell, more people are choosing to walk (5.7 percent) than use public transit (3.6 percent), even though the average commute is 25 minutes. If a public transit authority stops serving the public, it’s no surprise when its citizens abandon it.
Kaila Webb is the Wellesley College Freedom Project’s intern for the Pioneer Institute. She is currently double majoring in Environmental Studies and Chinese Language & Culture.

