
Status Report on the Job Creation Impact of the Life Sciences Act of 2008
This is the second in a continuing series of status reports published by Pioneer Institute on the Massachusetts Life Sciences Act of 2008 (LSA).
This report presents an analysis of job growth in the life sciences industry in Massachusetts and other states utilizing data from the Quarterly Census of Employment and Wages (QCEW) published by the U.S. Bureau of Labor Statistics (BLS). The data presented in this report are for the 69-month period (23 quarters) beginning with the first quarter of fiscal 2009, the effective date of the Massachusetts Life Sciences Act of 2008 (LSA), through the third quarter of fiscal 2014, the most recent quarter for which BLS data are available.
The LSA (Chapter 130 of the Acts of 2008) was enacted on June 16, 2008. The legislation established a basis for Massachusetts state government to invest $1 billion to expand life sciences-related employment and support research, development, manufacturing, and commercialization in the life sciences industry over a 10-year period, subject to continuing appropriation by the legislature. The tax incentive provisions of the LSA had an effective date of January 1, 2009. The act defines life sciences as advanced and applied sciences, including but not limited to regenerative medicine, biotechnology, biopharmaceuticals, nanotechnology, and medical devices. The Life Sciences Act established three funding mechanisms: the Life Sciences Investment Fund, capped at $250 million over the 10-year period, the Capital Program, capped at $500 million, and the Life Sciences Tax Incentive Program, capped at $250 million.
The LSA is administered by the Massachusetts Life Sciences Center (MLSC), a quasi-independent government entity established by Chapter 123 of the Acts of 2006. A seven-member board of directors governs MLSC, comprised of the secretary of administration and finance, the secretary of housing and economic development, the president of the University of Massachusetts, and four members appointed by the Governor on staggered terms. The ex-officio members may appoint designees to the board. Although established in 2006, the MLSC had no significant activity, and only one employee, through fiscal year 2008.
The Center’s enabling legislation requires MLSC to monitor and report on how many new life sciences jobs it has helped to create. An independent audit published by State Auditor Joseph DeNucci on August 27, 2010 reported that from July 1, 2007 through March 4, 2010, 443 permanent, full-time life science employee jobs and 176 construction jobs had been created. The auditor’s report described the job creation monitoring process as follows:
“MLSC tracks jobs created through its programs by requiring reports from recipient entities. Entities receiving tax incentives or funds from the Life Sciences Investment Fund must be registered life sciences companies, which are subject to annual reporting requirements. All capital grant agreements we reviewed specifically required recipients to annually report the number of employees employed and the total salary of these employees at the benefiting facility. The MLSC Chief Financial Officer monitors all jobs created and tracks them according to each MLSC program from which they are produced.”
The Life Sciences Act of 2008 anticipated an annual appropriation from the Legislature to the Massachusetts Life Sciences Investment Fund totaling $250 million over 10 years. The Massachusetts Life Sciences Investment Fund is used in part to pay for administrative and operating expenses of MLSC.
Figure 1 presents the amount that MLSC has expended or dispersed in each program since its inception. In total, $541.1 million has been incurred to date in the following nine programs, according to MLSC’s website on April 16, 2015.
Figure 1. The Cost of Mass. Life Sciences Center Programs, $millions
| MA Life Sciences Center Programs | Cost to date (millions) |
|---|---|
| Tax Incentive Program | $115.00 |
| Capital Program | $372.00 |
| Accelerator Loan Program | $20.80 |
| Cooperative Research Matching Grant Program | $6.80 |
| Life Sciences Milestone Achievement Program | $2.00 |
| Life Sciences International Collaborative Industry Program | $1.60 |
| Small Business Matching Grant Program | $4.00 |
| STEM Equipment and Supplies Grant Program | $12.00 |
| New Faculty Matching Grant Program | $3.80 |
| New Investigator Matching Grant Program | $3.10 |
| Total | $541.10 |
Figure 2 presents MLSC’s operating expenses from its inception through FY2014. Data for FY2010-FY2014 are derived from MLSC’s audited financial statements. Data from FY2007-FY2009 are derived from the previously-cited 2011 Massachusetts State Auditor’s report. Data from FY2007-FY2009 only include totals for each year and include property and equipment expenses. The data from FY2010-FY2014 do not include property and equipment expenses. The chart shows that total expenditures of $15,561,863 have been expended as described. Combined with the $541.1 million in program expenditures described in Figure 1, total expenditures at MLSC have totaled $566.7 million. FY2016 operating expenses are expected to add approximately $3 million.
Figure 2. MA Life Sciences Center Operating Expenses 2007-2014, $
| Operating Expenses | Salary and related employee expenses | Professional and consulting fees | Communications programs, sponsorships and contributions | General and administrative expenses | Total |
|---|---|---|---|---|---|
| FY2007 | na | na | na | na | $232,000 |
| FY2008 | na | na | na | na | $347,000 |
| FY2009 | na | na | na | na | $2,500,000 |
| FY2010 | $1,419,959 | $244,345 | $308,408 | $298,420 | $2,271,132 |
| FY2011 | $1,277,158 | $202,576 | $326,516 | $383,184 | $2,189,434 |
| FY2012 | $1,438,984 | $180,152 | $224,874 | $368,248 | $2,212,258 |
| FY2013 | $1,573,275 | $336,985 | $300,304 | $423,569 | $2,634,133 |
| FY2014 | $1,960,143 | $291,116 | $313,406 | $611,241 | $3,175,906 |
| FY2007-FY2014 | $7,669,519 | $1,255,174 | $1,473,508 | $2,084,662 | $15,561,863 |
Figure 3 presents a comparison of life science employment in Massachusetts in FY2009-Q1 and FY2014-Q3 using the definition of life science jobs employed by the Massachusetts Life Science Collaborative in its 2007 report entitled “Superclusters,” produced by its consultant, PricewaterhouseCoopers, LLC. This report was issued by MLSC during legislative deliberations about the Life Sciences Act. Its definition of the life sciences industry as presented here includes 21 North American Industrial Classification System (NAICS) sectors as indicated, each with a percentage (life sciences portion) of total sector employment attributable to life sciences. For example, NAICS sector 622-Hospitals, had 189,254 Massachusetts employees in FY2009-Q1 with 4.5 percent of them attributable to life sciences according to MLSC’s methodology, resulting in 8,516 life science jobs in FY2009-Q1. Likewise, total NAICS sector 622-Hospitals employment in FY2014-Q3 was 198,201 with 4.5 percent attributable to life sciences according to MLSC’s methodology, resulting in 8,919 life science jobs in FY2014-Q3. According to the methodology, NAICS sector 622-Hospitals therefore added 403 life science jobs (8,919-8,516=403) from FY2009-Q1 to FY2014-Q3. This methodology is employed with each of the 21 NAICS sectors that MLSC chose to include in its definition of life science employment in its “Superclusters” report.
Pioneer Institute has applied this same methodology to compute life science job gains/losses between FY2009-Q1 and FY2014-Q3. Pioneer has never used a self-designed methodology to measure life science employment gains/losses.
Figure 3 calculates that, using MLSC’s methodology as employed in its 2007 “Superclusters” report, Massachusetts added 3,639 life science jobs between FY2009-Q1 and FY2014-Q3.
Figure 3. Job gains (Mass Life Science Collaborative/PWC 2007 methodology), FY09/Q1-FY14/Q3
| NAICS Code | NAICS Industry Description | Sector total 2009-Q1 | Sector total 2014-Q3 | Life Sciences portion | Life science jobs 2009-Q1 | Life science jobs 2014-Q3 | Gain/loss 2009Q1-2014Q3 | Percent gain 2009Q1-2014Q3 |
|---|---|---|---|---|---|---|---|---|
| 622 | Hospitals | 189,254 | 198,201 | 4.50% | 8,516 | 8,919 | 403 | 4.70% |
| 325411 | Medicinal and botanical manufacturing | 433 | 207 | 100% | 433 | 207 | -226 | -52.20% |
| 325412 | Pharmaceutical preparation manufacturing | 7,182 | 7,567 | 100% | 7,182 | 7,567 | 385 | 5.40% |
| 325413 | In-vitro diagnostic substance manufacturing | 1,379 | 1,528 | 100% | 1,379 | 1,528 | 149 | 10.80% |
| 325414 | Other biological product manufacturing | 638 | 678 | 100% | 638 | 678 | 40 | 6.30% |
| 334510 | Electro-medical apparatus manufacturing | 5,221 | 3,695 | 100% | 5,221 | 3,695 | -1,526 | -29.20% |
| 334516 | Analytical laboratory instrument manufacturing | 5,358 | 6,546 | 100% | 5,358 | 6,546 | 1,188 | 22.20% |
| 334517 | Irradiation apparatus manufacturing | 1,048 | 961 | 100% | 1,048 | 961 | -87 | -8.30% |
| 339112 | Surgical and medical instrument manufacturing | 5,834 | 7,080 | 100% | 5,834 | 7,080 | 1,246 | 21.40% |
| 339113 | Surgical appliance and supplies manufacturing | 2,575 | 2,108 | 100% | 2,575 | 2,108 | -467 | -18.10% |
| 339114 | Dental equipment and supplies manufacturing | 337 | 409 | 100% | 337 | 409 | 72 | 21.40% |
| 339115 | Ophthalmic goods manufacturing | 1,104 | 744 | 100% | 1,104 | 744 | -360 | -32.60% |
| 339116 | Dental laboratories | 870 | 731 | 100% | 870 | 731 | -139 | -16.00% |
| 423450 | Medical equipment merchant wholesalers | 6,437 | 5,149 | 100% | 6,437 | 5,149 | -1,288 | -20.00% |
| 423460 | Ophthalmic goods merchant wholesalers | 359 | 316 | 100% | 359 | 316 | -43 | -12.00% |
| 424210 | Druggists goods merchant wholesalers | 4,429 | 4,149 | 100% | 4,429 | 4,149 | -280 | -6.30% |
| 541380 | Testing laboratories | 7,072 | 3,401 | 9% | 636 | 306 | -330 | -51.90% |
| 541711 | Research and development in biotechnology | 26,682 | 29,876 | 100% | 26,682 | 29,876 | 3,194 | 12.00% |
| 541712 | Other physical and biological research | 15,644 | 20,602 | 22% | 3,442 | 4,532 | 1,091 | 31.70% |
| 621511 | Medical laboratories | 3,455 | 4,048 | 100% | 3,455 | 4,048 | 593 | 17.20% |
| 621512 | Diagnostic imaging centers | 1,486 | 1,511 | 100% | 1,486 | 1,511 | 25 | 1.70% |
| TOTAL: MA Life Sciences per methodology of Mass Life Science Collaborative - PriceWaterhouseCooper (2007) | 87,422 | 91,061 | 3,639 | 4.20% |
Figure 4 is a graphic depiction of the data presented in Figure 3 showing the sectors that gained and lost jobs between FY2009-Q1 and FY2014-Q3 using MLSC’s methodology as employed in its 2007 “Superclusters” report.
Figure 4. Job gains (Mass Life Sciences Collaborative–PWC 2007 methodology), FY09/Q1 – FY14/Q3
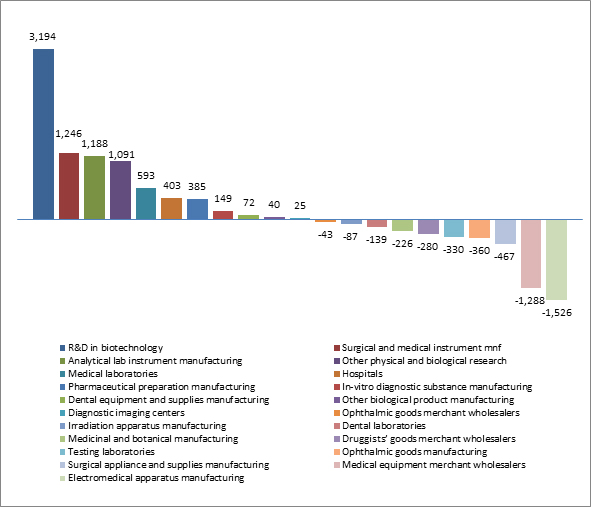
Figure 5 presents a comparison of life science employment in Massachusetts in FY2009-Q1 and FY2014-Q3 using the definition of life science jobs employed by the MassBiotechnology Council in its 2013 report entitled “Industry Snapshot.” Its definition of the life sciences industry, as presented here, includes 11 North American Industrial Classification System (NAICS) sectors as indicated, each with a percentage (life sciences portion) of total sector employment attributable to life sciences. Figure 5 calculates job gains using MLSC’s methodology as employed in its 2013 “Industry Snapshot” report.
According to the MassBiotechnology Council methodology, Massachusetts added 5,894 life science jobs between FY2009-Q1 and FY2014-Q3.
Figure 5. Job gains (MassBiotechnology Council 2013 methodology), FY09/Q1 – FY14/Q3
| NAICS Code | NAICS Industry Description | Sector total 2009-Q1 | Sector total 2014-Q3 | Life Sciences portion | Life science jobs 2009-Q1 | Life science jobs 2014-Q3 | Gain/loss 2009-2014 | Percent gain 2009-2014 |
|---|---|---|---|---|---|---|---|---|
| 622 | Hospitals | 189,254 | 198,201 | 4.5% | 8,516 | 8,919 | 403 | 4.70% |
| 61131 | Colleges and universities | 105,418 | 118,038 | 1.9% | 2,003 | 2,243 | 240 | 12.00% |
| 325411 | Medicinal and botanical manufacturing | 433 | 207 | 100% | 433 | 207 | -226 | -52.20% |
| 325412 | Pharmaceutical preparation manufacturing | 7,182 | 7,567 | 100% | 7,182 | 7,567 | 385 | 5.40% |
| 325413 | In-vitro diagnostic substance manufacturing | 1,379 | 1,528 | 100% | 1,379 | 1,528 | 149 | 10.80% |
| 325414 | Other biological product manufacturing | 638 | 678 | 100% | 638 | 678 | 40 | 6.30% |
| 334516 | Analytical laboratory instrument manufacturing | 5,358 | 6,546 | 30% | 1,607 | 1,964 | 356 | 22.20% |
| 541380 | Testing laboratories | 7,072 | 3,401 | 9% | 636 | 306 | -330 | -51.90% |
| 541711 | Research and development in biotechnology | 26,682 | 29,876 | 100% | 26,682 | 29,876 | 3,194 | 12.00% |
| 541712 | Other physical and biological research | 15,644 | 20602 | 22% | 3,442 | 4,532 | 1,091 | 31.70% |
| 621511 | Medical laboratories | 3,455 | 4,048 | 100% | 3,455 | 4,048 | 593 | 17.20% |
| TOTAL: MA Life Sciences per methodology of Mass Biotechnology Council "Industry Snapshot" (2013) | 55,974 | 61,868 | 5,894 | 10.50% |
Figure 6 is a graphic depiction of the data presented in Figure 5 showing the sectors that gained and lost jobs between FY2009-Q1 and FY2014-Q3, according to the methodology used by MassBiotechnology Council in its “Industry Snapshot” report in 2013.
Figure 6. Job gains (MassBiotechnology Council 2013 methodology), FY09/Q1 – FY14/Q3 (Graphical)
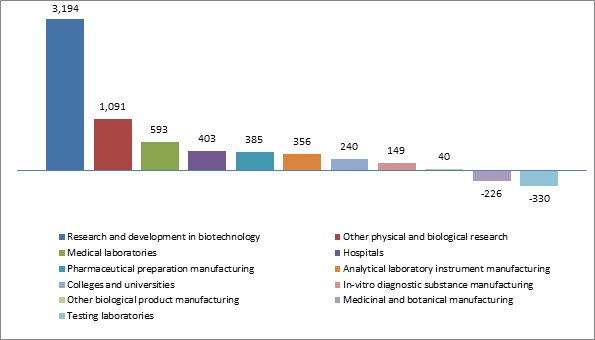
Figure 7 presents a comparison of life science employment in Massachusetts in FY2009-Q1 and FY2014-Q3 using the definition of life science jobs employed by the Boston Foundation in its 2013 report entitled “Life Science Innovation as a Catalyst for Economic Development : The Role of the Massachusetts Life Sciences Center” written by Northeastern University professors/economists Barry Bluestone and Alan Clayton-Matthews. Its definition of the life sciences industry, as presented here, includes 16 NAICS sectors as indicated, each with a percentage (life sciences portion) of total sector employment attributable to life sciences. Figure 5 calculates job gains using Boston Foundation as employed in its 2007 report.
According to the Boston Foundation methodology, Massachusetts added 4,280 life science jobs between FY2009-Q1 and FY2014-Q3.
Figure 7. Job gains (Boston Fdtn–Bluestone/Clayton-Matthews 2013 methodology), FY09/Q1–FY14/Q3
| NAICS Code | NAICS Industry Description | Sector total 2009-Q1 | Sector total 2014-Q3 | Life Sciences portion | Life science jobs 2009-Q1 | Life science jobs 2014-Q3 | Gain/loss 2009-2014 | Percent gain 2009-2014 |
|---|---|---|---|---|---|---|---|---|
| 325411 | Medicinal and botanical manufacturing | 433 | 207 | 100% | 433 | 207 | -226 | -52.20% |
| 325412 | Pharmaceutical preparation manufacturing | 7,182 | 7,567 | 100% | 7,182 | 7,567 | 385 | 5.40% |
| 325413 | In-vitro diagnostic substance manufacturing | 1,379 | 1,528 | 100% | 1,379 | 1,528 | 149 | 10.80% |
| 325414 | Other biological product manufacturing | 638 | 678 | 100% | 638 | 678 | 40 | 6.30% |
| 334510 | Electro-medical apparatus manufacturing | 5,221 | 3,695 | 100% | 5,221 | 3,695 | -1,526 | -29.20% |
| 334516 | Analytical laboratory instrument manufacturing | 5,358 | 6,546 | 100% | 5,358 | 6,546 | 1,188 | 22.20% |
| 334517 | Irradiation apparatus manufacturing | 1,048 | 961 | 100% | 1,048 | 961 | -87 | -8.30% |
| 339112 | Surgical and medical instrument manufacturing | 5,834 | 7,080 | 100% | 5,834 | 7,080 | 1,246 | 21.40% |
| 339113 | Surgical appliance and supplies manufacturing | 2,575 | 2,108 | 100% | 2,575 | 2,108 | -467 | -18.10% |
| 339114 | Dental equipment and supplies manufacturing | 337 | 409 | 100% | 337 | 409 | 72 | 21.40% |
| 423450 | Medical equipment merchant wholesalers | 6,437 | 5,149 | 100% | 6,437 | 5,149 | -1,288 | -20.00% |
| 424210 | Druggists' goods merchant wholesalers | 4,429 | 4,149 | 100% | 4,429 | 4,149 | -280 | -6.30% |
| 541380 | Testing laboratories | 7,072 | 3,401 | 100% | 7,072 | 3,401 | -3,671 | -51.90% |
| 541711 | Research and development in biotechnology | 26,682 | 29,876 | 100% | 26,682 | 29,876 | 3,194 | 12.00% |
| 541712 | Other physical and biological research | 15,644 | 20602 | 100% | 15,644 | 20,602 | 4,958 | 31.70% |
| 621511 | Medical laboratories | 3,455 | 4,048 | 100% | 3,455 | 4,048 | 593 | 17.20% |
| MA Life Sciences per methodology of Boston Foundation - Professors Bluestone/Clayton-Matthews (2013) | 93,724 | 98,004 | 4,280 | 4.60% |
Figure 8 is a graphic depiction of the data presented in Figure 7 showing the sectors that gained and lost jobs between FY2009-Q1 and FY2014-Q3, according to the methodology used by the Boston Foundation in its in its 2013 report entitled “Life Science Innovation as a Catalyst for Economic Development: The Role of the Massachusetts Life Sciences Center.”
Figure 8. Job gains/losses (Boston Foundation–Bluestone/Clayton-Matthews 2013 methodology), FY09/Q1 – FY14/Q3 (Graphical)
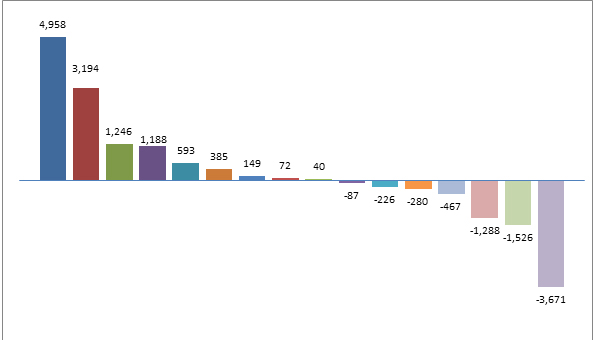
Figure 9 presents a comparison of Massachusetts life science employment in FY2009-Q1 and FY2014-Q3 using the definition of life science jobs employed by Battelle Memorial Institute and the Biotechnology Industry Organization in the 2014 edition of their biennial report “Battelle/BIO State Bioscience Jobs, Investments and Innovation.” Its definition of the life sciences industry includes 25 NAICS sectors of which nine are in the agricultural and feedstock NAICS group. Fewer than 100 Massachusetts residents in total are employed in the agricultural and feedstock sectors, so for the purpose of the present review of Massachusetts life sciences employment, these seven sectors are excluded from this analysis.[1] The remaining 16 sectors included in the Battelle/BIO methodology are presented here, each of which has a substantial level of Massachusetts employment. Figure 9 includes the percentage of total sector employment attributable to life sciences in Massachusetts according to Battelle/BIO. Because Battelle/BIO uses a proprietary state-by-state methodology to determine the relevant life sciences portion of several NAICS sectors, Pioneer was unable to employ its methodology later in this report for state-to-state comparisons, but Battelle/BIO generously shared the percentages for Massachusetts with Pioneer and therefore Pioneer is able to utilize this methodology for comparative purposes within Massachusetts from FY2009-Q1 to FY2014-Q3.
According to the Battelle/BIO methodology, Massachusetts added 6,107 life science jobs between FY2009-Q1 and FY2014-Q3.
[1] Wet Corn Milling, Soybean Processing, Other Oilseed Processing, Ethyl Alcohol Manufacturing, Cellulosic Organic Fiber Manufacturing, Nitrogenous Fertilizer Manufacturing, Phosphatic Fertilizer Manufacturing, Fertilizer Mixing Manufacturing, Pesticide and other Agricultural Chemical Manufacturing.
Figure 9. Job gains (Battelle/BIO methodology), 2014 FY09/Q1–FY14/Q3
| NAICS Code | NAICS Industry Description | Sector total 2009-Q1 | Sector total 2014-Q3 | Life Sciences portion | Life science jobs 2009-Q1 | Life science jobs 2014-Q3 | Gain/loss 2009-2014 | Percent gain 2009-2014 |
|---|---|---|---|---|---|---|---|---|
| 54171 | Physical, engineering and biological research | 40,628 | 50,478 | 75% | 30,471 | 37,859 | 7,388 | 24.20% |
| 325411 | Medicinal and botanical manufacturing | 433 | 207 | 100% | 433 | 207 | -226 | -52.20% |
| 325412 | Pharmaceutical preparation manufacturing | 7,182 | 7,567 | 100% | 7,182 | 7,567 | 385 | 5.40% |
| 325413 | In-vitro diagnostic substance manufacturing | 1,379 | 1,528 | 100% | 1,379 | 1,528 | 149 | 10.80% |
| 325414 | Other biological product manufacturing | 638 | 678 | 100% | 638 | 678 | 40 | 6.30% |
| 334510 | Electro-medical apparatus manufacturing | 5,221 | 3,695 | 100% | 5,221 | 3,695 | -1,526 | -29.20% |
| 334516 | Analytical laboratory instrument manufacturing | 5,358 | 6,546 | 100% | 5,358 | 6,546 | 1,188 | 22.20% |
| 334517 | Irradiation apparatus manufacturing | 1,048 | 961 | 100% | 1,048 | 961 | -87 | -8.30% |
| 339112 | Surgical and medical instrument manufacturing | 5,834 | 7,080 | 100% | 5,834 | 7,080 | 1,246 | 21.40% |
| 339113 | Surgical appliance and supplies manufacturing | 2,575 | 2,108 | 100% | 2,575 | 2,108 | -467 | -18.10% |
| 339114 | Dental equipment and supplies manufacturing | 337 | 409 | 100% | 337 | 409 | 72 | 21.40% |
| 423450 | Medical equipment merchant wholesalers | 6,437 | 5,149 | 100% | 6,437 | 5,149 | -1,288 | -20.00% |
| 424210 | Druggists' goods merchant wholesalers | 4,429 | 4,149 | 74% | 3,277 | 3,070 | -207 | -6.30% |
| 424910 | Farm supplies merchant wholesalers | 344 | 477 | 72% | 248 | 343 | 96 | 38.70% |
| 541380 | Testing laboratories | 7,072 | 3,401 | 34% | 2,404 | 1,156 | -1,248 | -51.90% |
| 621511 | Medical laboratories | 3,455 | 4,048 | 100% | 3,455 | 4,048 | 593 | 17.20% |
| MA Life Sciences per methodology of Battelle/BIO State Bioscience Jobs, Investments and Innovation (2014) | 76,298 | 82,405 | 6,107 | 8.00% |
Figure 10 is a graphic depiction of the data presented in Figure 9 showing the sectors that gained and lost jobs between FY2009-Q1 and FY2014-Q3, according to the methodology used by the Battelle/BIO in its in its 2014 report entitled “Battelle/BIO State Bioscience Jobs, Investments and Innovation.”
Figure 10. Job gains (Battelle/BIO State methodology), FY09/Q1 – FY14/Q3 (Graphical)
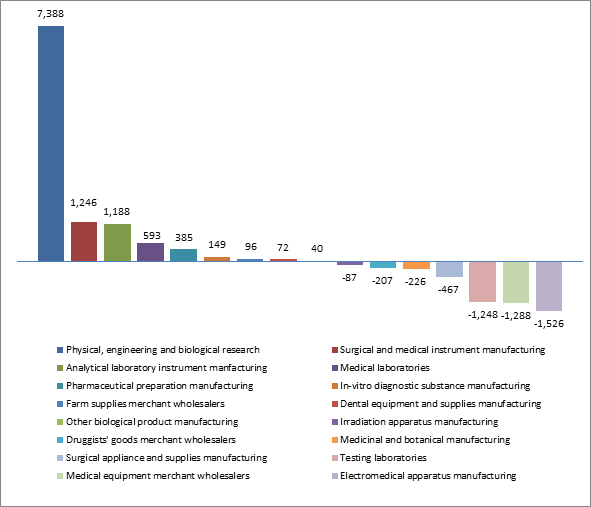
Figure 11 presents a state-by-state comparison of job gains in life sciences using the methodology employed by the MLSC in its 2007 report entitled “Superclusters” produced by its consultant PricewaterhouseCoopers, LLC. The top 20 states are presented, ranked by total jobs gained between FY2009-Q1 and FY2014-Q3. Full state-by-state data is available in downloadable form by clicking on a link elsewhere on the Pioneer Institute website.
Massachusetts ranked seventh in job gains with 3,639.
Figure 11. Top 20 States for Job Gains (Mass Life Science Center–PWC 2007 methodology)
| State | LS jobs 2009-Q1 per MLSC | LS jobs 2014-Q3 per MLSC | % job gain per MLSC | % job gain rank |
|---|---|---|---|---|
| CA | 260,388 | 280,154 | 19,766 | 1 |
| NC | 67,003 | 75,878 | 8,876 | 2 |
| TX | 101,379 | 108,695 | 7,315 | 3 |
| UT | 24,002 | 29,425 | 5,424 | 4 |
| MI | 51,848 | 56,581 | 4,733 | 5 |
| AZ | 25,203 | 29,876 | 4,673 | 6 |
| MA | 87,422 | 91,061 | 3,639 | 7 |
| FL | 105,459 | 108,797 | 3,338 | 8 |
| CO | 30,911 | 33,960 | 3,049 | 9 |
| KY | 12,974 | 14,924 | 1,950 | 10 |
| AL | 14,355 | 15,737 | 1,382 | 11 |
| OR | 14,422 | 15,222 | 800 | 12 |
| NV | 7,656 | 8,338 | 681 | 13 |
| MT | 2,465 | 3,131 | 666 | 14 |
| NY | 111,038 | 111,578 | 540 | 15 |
| ID | 6,525 | 6,987 | 462 | 16 |
| GA | 36,025 | 36,432 | 406 | 17 |
| WI | 33,536 | 33,865 | 330 | 18 |
| MN | 49,608 | 49,922 | 314 | 19 |
| OH | 57,420 | 57,636 | 217 | 20 |
Figure 12 presents a graphic depiction of the data presented in Figure 11 of the state-by-state comparison of job gains in life sciences using the methodology employed by the MLSC in its 2007 report entitled “Superclusters” produced by its consultant PricewaterhouseCoopers, LLC. The top 20 states are presented, ranked by total jobs gained between FY2009-Q1 and FY2014-Q3.
Figure 12. Top 20 States for Job Gains (Mass Life Science Collaborative–PWC 2007 methodology) (Graphical)

Figure 13 presents a state-by-state comparison of percentage increase in life sciences jobs using the methodology employed by the MLSC in its 2007 report entitled “Superclusters” produced by its consultant PricewaterhouseCoopers, LLC. The top 20 states are presented, ranked by percent increase in jobs between FY2009-Q1 and FY2014-Q3.
Massachusetts ranked 16th in job gains at 4.2 percent.
Figure 13: Top 20 States for Job Gains by Percentage (Mass Life Science Collaborative– PWC 2007 methodology)
| State | LS jobs 2009-Q1 per MLSC | LS jobs 2014-Q3 per MLSC | % job gain per MLSC | % job gain rank |
|---|---|---|---|---|
| MT | 2,465 | 3,131 | 27.00% | 1 |
| UT | 24,002 | 29,425 | 22.60% | 2 |
| AZ | 25,203 | 29,876 | 18.50% | 3 |
| KY | 12,974 | 14,924 | 15.00% | 4 |
| NC | 67,003 | 75,878 | 13.20% | 5 |
| AK | 1,268 | 1,434 | 13.10% | 6 |
| CO | 30,911 | 33,960 | 9.90% | 7 |
| AL | 14,355 | 15,737 | 9.60% | 8 |
| MI | 51,848 | 56,581 | 9.10% | 9 |
| NV | 7,656 | 8,338 | 8.90% | 10 |
| CA | 260,388 | 280,154 | 7.60% | 11 |
| TX | 101,379 | 108,695 | 7.20% | 12 |
| ID | 6,525 | 6,987 | 7.10% | 13 |
| OR | 14,422 | 15,222 | 5.50% | 14 |
| ND | 1,743 | 1,831 | 5.00% | 15 |
| MA | 87,422 | 91,061 | 4.20% | 16 |
| FL | 105,459 | 108,797 | 3.20% | 17 |
| DE | 5,574 | 5,740 | 3.00% | 18 |
| NM | 11,383 | 11,546 | 1.40% | 19 |
| GA | 36,025 | 36,432 | 1.10% | 20 |
Figure 14 presents a graphic depiction of the data presented in Figure 13 of the state-by-state comparison of percentage increase in life science jobs using the methodology employed by the MLSC in its 2007 report entitled “Superclusters” produced by its consultant PricewaterhouseCoopers, LLC. The top 20 states are presented, ranked by increase in life science jobs between FY2009-Q1 and FY2014-Q3.
Figure 14. Top 20 States for Jobs Gains by Percentage (Mass Life Science Collaborative–PWC 2007 methodology) (Graphical)
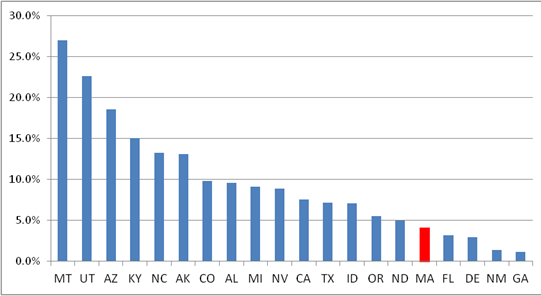
Figure 15 presents a state-by-state comparison of job gains in life sciences using the methodology employed by the by the MassBiotechnology Council in its 2013 report entitled “Industry Snapshot.” The top 20 states are presented, ranked by total jobs gained between FY2009-Q1 and FY2014-Q3. Full state-by-state data is available in downloadable form by clicking on a link elsewhere on the Pioneer Institute website.
Massachusetts ranked 3rd in job gains with 5,894.
Figure 15. Top 20 States for Job Gains (Mass BioTechnology Council 2013 methodology)
| State | LS jobs 2009-Q1 per MBTC | LS jobs 2014-Q3 per MBTC | % job gain per MBTC | % job gain rank |
|---|---|---|---|---|
| CA | 139,681 | 155,009 | 15,329 | 1 |
| NC | 46,217 | 53,654 | 7,437 | 2 |
| MA | 55,974 | 61,868 | 5,894 | 3 |
| TX | 50,722 | 55,385 | 4,664 | 4 |
| FL | 36,315 | 39,371 | 3,056 | 5 |
| AZ | 11,696 | 14,447 | 2,751 | 6 |
| MI | 27,813 | 30,262 | 2,449 | 7 |
| UT | 11,707 | 13,990 | 2,283 | 8 |
| CO | 13,856 | 15,762 | 1,906 | 9 |
| OH | 28,978 | 30,663 | 1,685 | 10 |
| AL | 8,428 | 10,002 | 1,574 | 11 |
| NY | 63,810 | 65,113 | 1,303 | 12 |
| WI | 14,925 | 16,222 | 1,297 | 13 |
| KY | 6,952 | 8,167 | 1,215 | 14 |
| DE | 1,744 | 2,925 | 1,181 | 15 |
| GA | 17,666 | 18,706 | 1,040 | 16 |
| OR | 6,838 | 7,779 | 941 | 17 |
| IA | 7,035 | 7,812 | 777 | 18 |
| MN | 13,898 | 14,644 | 746 | 19 |
| ID | 3,465 | 4,210 | 745 | 20 |
Figure 16 presents a graphic depiction of the data presented in Figure 15 of the state-by-state comparison of life science job gains using the methodology employed by the by the MassBiotechnology Council in its 2013 report entitled “Industry Snapshot.” The top 20 states are presented, ranked by total jobs gained between FY2009-Q1 and FY2014-Q3.
Figure 16. Job Gains – Top 20 States (Mass BioTechnology Council 2013 methodology) (Graphical)
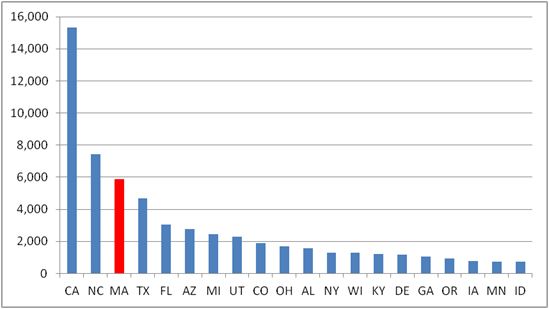
Figure 17 presents a state-by-state comparison of percentage increase in life sciences jobs using the methodology employed by the by the MassBiotechnology Council in its 2013 report entitled “Industry Snapshot.” The top 20 states are presented, ranked by percent increase in jobs between FY2009-Q1 and FY2014-Q3.
Massachusetts ranked 14th in job gains at 10.5 percent.
Figure 17. Top 20 States for Job Gains by Percentage (Mass BioTechnology Council 2013 methodology)
| State | LS jobs 2009-Q1 per MBTC | LS jobs 2014-Q3 per MBTC | % job gain per MBTC | % job gain rank |
|---|---|---|---|---|
| DE | 1,744 | 2,925 | 67.70% | 1 |
| MT | 1,704 | 2,268 | 33.10% | 2 |
| AZ | 11,696 | 14,447 | 23.50% | 3 |
| ID | 3,465 | 4,210 | 21.50% | 4 |
| UT | 11,707 | 13,990 | 19.50% | 5 |
| AK | 780 | 932 | 19.50% | 6 |
| AL | 8,428 | 10,002 | 18.70% | 7 |
| KY | 6,952 | 8,167 | 17.50% | 8 |
| NC | 46,217 | 53,654 | 16.10% | 9 |
| OR | 6,838 | 7,779 | 13.80% | 10 |
| CO | 13,856 | 15,762 | 13.80% | 11 |
| IA | 7,035 | 7,812 | 11.00% | 12 |
| CA | 139,681 | 155,009 | 11.00% | 13 |
| MA | 55,974 | 61,868 | 10.50% | 14 |
| TX | 50,722 | 55,385 | 9.20% | 15 |
| MI | 27,813 | 30,262 | 8.80% | 16 |
| WI | 14,925 | 16,222 | 8.70% | 17 |
| AR | 3,765 | 4,082 | 8.40% | 18 |
| FL | 36,315 | 39,371 | 8.40% | 19 |
| LA | 7,731 | 8,323 | 7.70% | 20 |
Figure 18 presents a graphic depiction of the data presented in Figure 17 of the state-by-state comparison of percentage increase in life science jobs using the methodology employed by the by the MassBiotechnology Council in its 2013 report entitled “Industry Snapshot.” The top 20 states are presented, ranked by increase in life science jobs between FY2009-Q1 and FY2014-Q3.
Figure 18. Top 20 States for Job Gains by Percentage (Mass BioTechnology Council 2013 methodology), (Graphical)
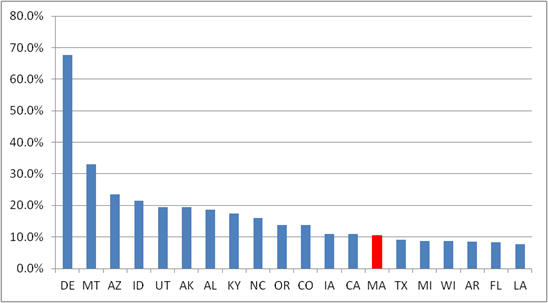
Figure 19 presents a state-by-state comparison of job gains in life sciences using the definition of life science jobs employed by the Boston Foundation in its 2013 report entitled “Life Science Innovation as a Catalyst for Economic Development: The Role of the Massachusetts Life Sciences Center” written by Northeastern University professors/economists Barry Bluestone and Alan Clayton-Matthews. The top 20 states are presented, ranked by total jobs gained between FY2009-Q1 and FY2014-Q3. Full state-by-state data is available in downloadable form by clicking on a link elsewhere on the Pioneer Institute website.
Massachusetts ranked eighth in job gains with 4,280.
Figure 19. Top 20 States for Job Gains (Boston Foundation-Bluestone/Clayton-Matthews 2013 methodology)
| State | LS jobs 2009-Q1 per BF/NU | LS jobs 2014-Q3 per BF/NU | Job gains per BF/NU | Added jobs rank per BF/NU |
|---|---|---|---|---|
| CA | 301,036 | 328,626 | 27,590 | 1 |
| MI | 63,911 | 82,975 | 19,064 | 2 |
| NC | 67,422 | 76,350 | 8,928 | 3 |
| TX | 95,953 | 102,316 | 6,363 | 4 |
| UT | 24,594 | 30,324 | 5,730 | 5 |
| AZ | 23,091 | 28,764 | 5,673 | 6 |
| FL | 86,561 | 91,271 | 4,710 | 7 |
| MA | 93,724 | 98,004 | 4,280 | 8 |
| DE | 4,744 | 7,860 | 3,116 | 9 |
| CO | 35,644 | 38,116 | 2,472 | 10 |
| GA | 28,064 | 30,250 | 2,186 | 11 |
| MN | 47,450 | 49,430 | 1,980 | 12 |
| KY | 9,342 | 11,302 | 1,960 | 13 |
| OH | 55,702 | 57,427 | 1,725 | 14 |
| LA | 9,857 | 11,535 | 1,678 | 15 |
| OR | 12,779 | 14,184 | 1,405 | 16 |
| WI | 30,114 | 31,274 | 1160 | 17 |
| AL | 14,439 | 15,578 | 1139 | 18 |
| NY | 109,517 | 110,629 | 1112 | 19 |
| NM | 26,191 | 27,274 | 1083 | 20 |
Figure 20 presents a graphic depiction of the data presented in Figure 19 of the state-by-state comparison of job gains in life sciences using the definition of life science jobs employed by the Boston Foundation in its 2013 report entitled “Life Science Innovation as a Catalyst for Economic Development: The Role of the Massachusetts Life Sciences Center” written by Northeastern University professors/economists Barry Bluestone and Alan Clayton-Matthews. The top 20 states are presented, ranked by total jobs gained between FY2009-Q1 and FY2014-Q3.
Figure 20. Top 20 States for Job Gains (Boston Foundation-Bluestone/Clayton-Matthews 2013 methodology) (Graphical)
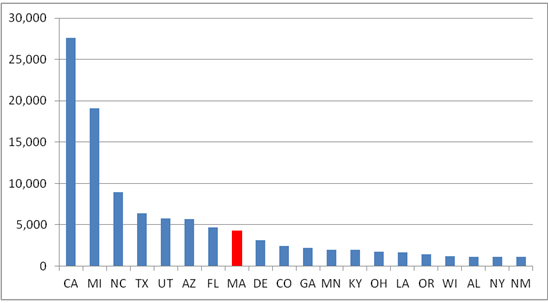
Figure 21 presents a state-by-state comparison of percentage increase in life sciences jobs using the definition of life science jobs employed by the Boston Foundation in its 2013 report entitled “Life Science Innovation as a Catalyst for Economic Development: The Role of the Massachusetts Life Sciences Center” written by Northeastern University professors/economists Barry Bluestone and Alan Clayton-Matthews. The top 20 states are presented, ranked by percent increase in jobs between FY2009-Q1 and FY2014-Q3.
Massachusetts ranked 19th in job gains at 4.6 percent.
Figure 21. Top 20 States for Job Gains by Percentage (Boston Foundation-Bluestone/Clayton-Matthews 2013 methodology)
| State | LS jobs 2009-Q1 per MBTC | LS jobs 2014-Q3 per MBTC | % job gain per MBTC | % job gain rank |
|---|---|---|---|---|
| DE | 4,744 | 7,860 | 65.68% | 1 |
| MI | 63,911 | 82,975 | 29.83% | 2 |
| MT | 2,137 | 2,690 | 25.88% | 3 |
| AZ | 23,091 | 28,764 | 24.57% | 4 |
| UT | 24,594 | 30,324 | 23.30% | 5 |
| AK | 1332 | 1636 | 22.82% | 6 |
| KY | 9,342 | 11,302 | 20.98% | 7 |
| LA | 9,857 | 11,535 | 17.02% | 8 |
| NC | 67,422 | 76,350 | 13.24% | 9 |
| ND | 1,541 | 1,740 | 12.91% | 10 |
| OR | 12,779 | 14,184 | 10.99% | 11 |
| IA | 8,262 | 9,040 | 9.42% | 12 |
| CA | 301,036 | 328,626 | 9.17% | 13 |
| AL | 14,439 | 15,578 | 7.89% | 14 |
| GA | 28,064 | 30,250 | 7.79% | 15 |
| CO | 35,644 | 38,116 | 6.94% | 16 |
| TX | 95,953 | 102,316 | 6.63% | 17 |
| FL | 86,561 | 91,271 | 5.44% | 18 |
| MA | 93,724 | 98,004 | 4.57% | 19 |
| MN | 47,450 | 49,430 | 4.17% | 20 |
Figure 22 presents a graphic depiction of the data presented in Figure 21 of the state-by-state comparison of percentage increase in life science jobs using the definition of life science jobs employed by the Boston Foundation in its 2013 report entitled “Life Science Innovation as a Catalyst for Economic Development – The Role of Massachusetts Life Science Sector” written by Northeastern University professors/economists Barry Bluestone and Alan Clayton-Matthews. The top 20 states are presented, ranked by increase in life science jobs between FY2009-Q1 and FY2014-Q3.
Figure 22. Percent job gains – Top 20 States (methodology used by Boston Foundation-Professors Bluestone/Clayton-Matthews, 2013)

Figure 23 presents Bureau of Labor Statistics data for total Massachusetts employment in all sectors for FY2009-Q1 and FY2014-Q3. During this period, Massachusetts added 261,876 net new jobs, an increase of 8.4 percent.
Figure 23. Massachusetts All Industry Job Gains, 2009/Q1 – 2014/Q3
| NAICS Code | NAICS Industry Description | Total jobs 2009-Q1 | Total jobs 2014-Q3 | Gain/loss 2009-2014 | Percent gain 2009-2014 |
|---|---|---|---|---|---|
| 54171 | Total, all industries | 3,124,780 | 3,386,656 | 261,876 | 8.40% |
Figure 24 compares Massachusetts percentage job growth between FY2009-Q1 and FY2014-Q3 with Massachusetts life sciences percentage job growth over the same period. Over this period, Massachusetts total employment grew by 8.4 percent. Measured by the MassBiotechnology Council methodology, life science job growth was greater, at 10.6 percent. By the other three methodologies, it was lower. Measured by the Mass Life Science Collaborative methodology, Massachusetts life science job growth was virtually half as much by percent as Massachusetts overall job growth (4.2 percent vs. 8.4 percent). The average percentage job growth of the four methodologies was 6.9 percent, less than Massachusetts percentage job growth, 8.4 percent, between FY2009-Q1 and FY2014-Q3.
Figure 24. Life Sciences Job Gains & Massachusetts Total Job Gains, 2009/Q1 – 2014/Q3
| Job gain 2009-2014 | Percent gain 2009-2014 | |
|---|---|---|
| Life sciences job gains (methodology used by MA Life Sciences Center, 2007) | 3,657 | 4.20% |
| Life sciences job gains (methodology used by MassBiotechnology Council, 2013) | 5,913 | 10.60% |
| Life sciences job gains (methodology used by Boston Foundation/Bluestone, 2013) | 4,364 | 4.70% |
| Life sciences job gains (methodology used by Battelle/BIO, 2014) | 6,107 | 8.00% |
| Life sciences job gains (average of 4 methodologies) | 5,010 | 6.90% |
| Total job gains Massachusetts | 261,876 | 8.40% |
Figure 25 calculates how much MLSC has spent thus far per life sciences job added in Massachusetts between FY2009-Q1 and FY2014-Q2 on the basis of MLSC expenditures as shown in Figures 1 and Figure 2 above. MLSC thus far has spent $556.7 million with a net increase of 5,010 life science jobs, according to the average of the four measures of life science employment review in this report. That translates to approximately $111,000 per job added.
Figure 25. The Cost of Each Added Life Sciences Job, 2009/Q1 – 2014/Q3, $
| Life Science cost through 2014-Q3 | Job gains 2009-Q1 to 2014-Q3 | Cost per added job | |
|---|---|---|---|
| Life Science Act costs(Figure 1 and Figure 2) per life sciences job added (average of 4 methodologies) | $566,700,000 | 5,010 | $113.11 |
Conclusion
Pioneer Institute has taken the methodology used in four major studies of the Massachusetts life sciences sector and replicated each to calculate state life science job growth from the first quarter of fiscal 2009, the effective date of the Massachusetts Life Sciences Act of 2008, and the third quarter of fiscal 2014, the most recent quarter for which data are available from the U.S. Bureau of Labor Statistics.
Using the methodology employed by PricewaterhouseCoopers, LLC in “Superclusters,” the 2007 study it conducted for the Massachusetts Life Sciences Center, Massachusetts added 3,639 life science jobs during the period in question. In terms of raw numbers, that ranks Massachusetts seventh in life science job growth among the states during that period.
Replicating the methodology used by the MassBiotechnology Council in its 2013 “Industry Snapshot,” life science employment grew by 5,894 jobs during the term explored in this study, ranking third among the states in the number of jobs created.
Applying the methodology used by two Northeastern University economists in “Life Science Innovation as a Catalyst for Economic Development: The Role of the Massachusetts Life Sciences Center,” which was published by the Boston Foundation in 2013, Massachusetts added 4,280 life science jobs during the 2009-2014 period, a number that ranks 19th among the states.
Using the methodology in “Battelle/BIO State Bioscience Jobs, Investments and Innovation 2014,” from the Battelle Memorial Institute and the Biotechnology Industry Organization, Massachusetts gained 6,107 jobs during the applicable period. Data to rank the number of jobs created against other states are unavailable.
From the first quarter of fiscal 2009 through the end of the third quarter of fiscal 2014, the total number of jobs in Massachusetts increased by 8.4 percent, according to BLS. That number is below the 10.5 percent life science job growth during that time as calculated using the MassBiotechnology Council methodology. But life science job growth was less than the overall 8.4 percent Massachusetts rate using the methodologies employed in the other three studies. Life science job growth was 4.2 percent according to the Massachusetts Life Sciences Center methodology, 4.6 percent under the methodology used by the Boston Foundation, and 8 percent when the Battelle/BIO methodology is applied.
The Massachusetts Life Science Center has thus far spent $556.7 million (see Figures 1 and 2). If we average the job creation numbers arrived at by duplicating the methodologies of the four studies discussed above, the number is 5,010, which comes out to $111,118 per job.
Data available for download:
MBTC methodology data 50 states

