
Spending on Students: How Does Groton Compare?
Massachusetts is known for the strength of its K-12 education. US News & World Report recently ranked the commonwealth’s public-school districts. Having grown up in Groton, I wanted to see the correlation between educational expenditures and school district performance in the town.
How does Groton’s education spending compare to Massachusetts towns with similar demographics? How about neighboring towns? To find out, I used MassAnalysis, a free, online transparency tool offered by Pioneer Institute. MassAnalysis uses financial information provided by the municipalities to the Department of Revenue (DOR).
MassAnalysis has two simultaneously useful features, the first is a peer analysis tool which compares a town of interest with other municipalities that are similar based on certain parameters. To analyze Groton and its peer communities, I included crime level, land area, population, average single-family tax value, and per capita income. The database also allows users to look at all the data for a given municipality over time. While some towns in the closest proximity to Groton are not considered “peers,” analysis of these towns also provides helpful comparisons.
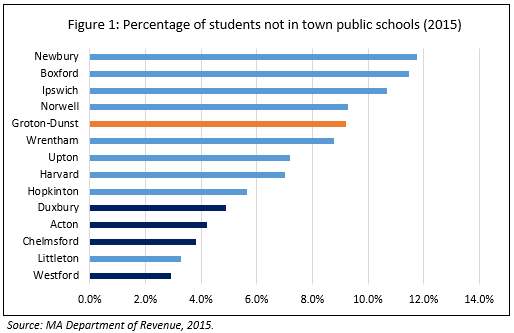
Groton is part of a regional school district with neighboring Dunstable, which may affect its expenditure levels among other single-town districts. Comparing public school enrollment in Groton with peer communities, 9.2 percent of Groton-Dunstable’s student population does not attend its public schools. This is one of the higher levels across its peer towns, and far above the levels of most school districts that US News & World Report ranks above it (dark blue). Four of such high-ranking towns have among the lowest levels of students who do not attend their public schools, including Duxbury, Acton, Chelmsford, and Westford.
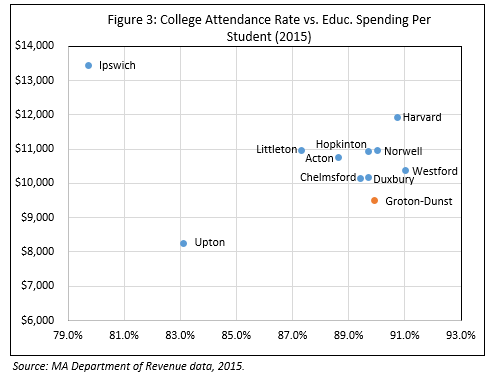
This leads to an inquiry of each town’s education expenditures as a function of their residential population and their student population. Figure 3 presents each district’s per student spending on education. Based on FY2015 expenditure levels, Groton falls below all but one of peer communities. Although Groton’s student body is smaller than those in many other towns, it has a large number of students as a percentage of the total population. Groton-Dunstable is one of the lowest per-student spenders on education, both among towns with similarly sized student populations as well as among some towns with even smaller student populations.

Groton-Dunstable is second lowest in terms of per-student education spending at just over $9,400. The district remains one of two lowest spenders, both of which spend considerably less than the other peer communities. All other peer towns are either relatively close to the median spending level (equal to $10,853) or above it. Groton-Dunstable spends less than most other districts in this comparison, yet is ranked higher academically by Niche.com and US News & World Report than schools in Norwell, Chelmsford, Ipswich, Littleton, Wrentham, and Boxford.
Data for school spending is from the Massachusetts Department of Revenue (DOR) reports. The educational spending reported to DOR differs from amounts reported elsewhere. The Massachusetts Department of Elementary and Secondary Education reports that Groton-Dunstable spent $13,088 per student in 2015, an amount that includes costs like retirement and allocated costs. However, even according to fully loaded DESE data, Groton-Dunstable still spends considerably less per student than Boxford, Newbury, Norwell, Littleton, and Ipswich, which are all ranked lower than Groton-Dunstable’s student outcomes.
To measure academic outcomes for every town, data from the Massachusetts Department of Education shows college attendance rates for each school district. Among towns that spend the lowest amounts on education per student (Chelmsford, Upton, Duxbury, and Groton-Dunstable), Groton-Dunstable had the highest rate of college attendance in the 2014-15 academic year, with nearly 90 percent of graduates going on to higher education. Additionally, within the cluster of towns with college attendance rates above 85 percent, Groton-Dunstable had the lowest levels of per student spending. Thus, the district seems to be very efficient, spending less than other high-ranking towns while producing very successful outcomes.
These comparisons are helpful when looking at Groton-Dunstable’s education expenditures relative to its peer communities. However, because Groton is part of a regional school district, some of the comparisons may not tell the whole education finance story.
Therefore, I compared Groton-Dunstable Regional District Schools with other highly ranked nearby Massachusetts regional districts by creating profiles of each region based on MassAnalysis data for each town. The districts include Acton-Boxborough, Ayer-Shirley, Lincoln-Sudbury, Mendon-Upton, Triton Regional, North Middlesex Regional, and Nashoba Regional. In terms of students who do not attend the public-school system, Groton-Dunstable still ranks highest at 11.9 percent, while the median for other school districts is 7 percent. In comparison with other regional districts, Groton-Dunstable spends less per student than the median, according to both DOR and DESE reports.
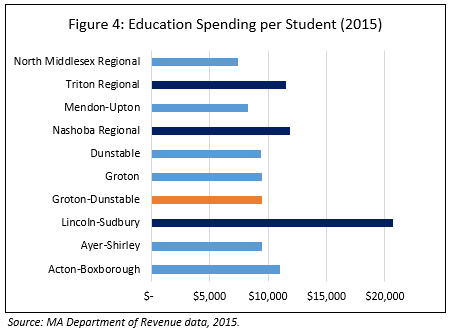
According to ratings and data provided by Niche.com and US News & World Report, the Groton-Dunstable Regional school district ranks higher than Lincoln-Sudbury, Nashoba Regional, and Triton Regional, all coded in dark blue, which are above the median on per-student education spending. The takeaway here is that higher levels of spending do not necessarily correlate with academic success.
Up close, the numbers are interesting. On average, Groton-Dunstable spent $9,489 per student in 2015, compared to a median of $10,279. In terms of student population, 2,490 G-D students attend the regional K-12 schools, which is also below the median for other districts. There is a slight correlation between student population size and per-student education expenditures; for every additional student, a district pays another dollar per student. Of course, the sample of regional districts is small and there are outliers. Lincoln-Sudbury has a fairly average-sized student population, yet pays upwards of $20,000 per student, according to MassAnalysis data.
Compared to Groton-Dunstable, the Lincoln-Sudbury case is also compelling. Despite per-pupil spending that is more than double G-D’s, US News & World Report ranks Groton-Dunstable higher based on graduation rates, college readiness, and other academic metrics. In a less extreme case, Ayer-Shirley spends slightly more per student, yet ranks 38 spots below Groton-Dunstable academically.
Spending more on education may seem like the best way to improve academic outcomes, but this doesn’t appear to be the case in Groton. Despite below average per-student expenditures, the Groton-Dunstable Regional School District has very high graduation rates and college readiness rankings, and is competitive with some of the best school districts in Massachusetts. The question is, can Groton’s success be a model for other school districts?

