
Biotech job creation estimates don’t add up
Pioneer today released a new report entitled “Regaining Massachusetts’ Edge in Research and Development.” The report focuses on three important takeaways from the job creation and investment data as related to R&D-related companies:
- A broader tax credit strategy put into place in the early 1990s worked quite well in advancing Massachusetts’ R&D-related job base and expanding R&D investments in the Commonwealth
- Since then California has put into place a more cutting edge tax credit strategy that has helped the state become a category killer – truly the first among equals in the hunt for expansion of R&D-related sectors
- While Massachusetts’ life sciences initiative was much ballyhooed as having the potential to create 250,000 new jobs in a decade, after five years of implementation and more than five-hundred millions of dollars spent, Massachusetts has seen net growth of 571 jobs in the life sciences according to the methodology used by the Massachusetts Life Science Center, “Superclusters.”
This last bullet has caused some consternation among proponents of the life sciences initiative. The State House News Service tells us at 5:30 this evening that the study has “come under fire from Senate President Therese Murray and Massachusetts Life Sciences Center President Susan Windham-Bannister.”
I respect both of these officials greatly, but stand by the results of our study, which as SHNS rightly summarized “concluded the $1 billion life sciences law approved in 2008 has created just 571 direct life sciences jobs since tax credits kicked in during 2009 and called for a broader tax credit to attract research and development initiatives across sectors.” SHNS further reported that
Windham-Bannister, in an interview from the BIO convention in San Diego, said validated data shows state tax incentives have created more than 4,400 new jobs in Massachusetts since 2009, or more per capita than any other state.
Three other studies, Windham-Bannister said, have concluded higher levels of life sciences job creation associated with the law. “We just don’t understand how the Pioneer Institute did its analysis,” she said.
Murray, who is also in San Diego, said she was “a little surprised” by the study.
“It seems like they started with the conclusion and created a study to support the conclusion,” she said.
Actually, that’s not the case.
Pioneer is not seeking to call into question colleagues’ intentions. But with officials questioning our analyses, we have little recourse besides going public with the facts. There are questionable assumptions in the 2014 Bluestone/Clayton-Matthews’ report came to light during an investigation we were conducting on the life sciences initiative.
How did we understand that? As part of our research effort, we studied the methodologies used in existing research to measure Massachusetts life science employment. We then used those methodologies to compute how many life science jobs had been created between 2009Q1 and 2013Q3 as measured by those methodologies. We conducted calculations based on three studies.
- We calculated life science job gains by the methodology used in a 2007 report issued by the Massachusetts Life Science Center, “Superclusters.” According to that methodology, which was used to advocate for the life sciences initiative in Massachusetts, the Commonwealth has gained 571 life science jobs between 2009Q1 and 2009Q3.
- Pioneer also calculated life science job gains using the methodology employed by MassBiotechnology Council’s report entitled “2013 Industry Snapshot.” Measured by that methodology, 3,024 life science jobs had been gained. In that report, the jobs numbers were boosted by dropping 11 industry sectors that had incurred net losses of 2,267 jobs.
And we were also pleased to use job calculation methods employed in Professors Bluestone and Clayton-Matthews’ 2013 report, “Life Science Innovation as a Catalyst for Economic Development,” as well. In our report, “Regaining Massachusetts’ Edge,” we calculate that only 1,438 jobs have been created using the methodology released by Bluestone and Clayton-Matthews in their March 2013 report on the life science initiative.
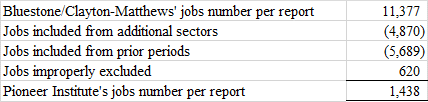
Then serendipitously (or perhaps unfortunately) last week came the release of a study entitled “Massachusetts Life Science Employment: 2010-2012” by Professors Bluestone and Clayton-Matthews. This 2014 update of their previous study now claimed that the Massachusetts life science initiative has generated 11,377 new jobs in Massachusetts.
A few press reports questioned whether our conclusions were due to the use of a “narrower” definition than other studies, and in particular Professors Bluestone and Clayton-Matthews, when calculating life science jobs and job growth.
The answer to that is no.
My Pioneer report calculates job numbers based on the exact methodology employed in their March 2013 report. The professors’ 2013 report had included 16 specific North American Industrial Classification System (NAICS) sectors and employed data reported by the National Center for Science and Engineering Statistics.
Had Professors Bluestone and Clayton-Matthews stuck with their 2013 methodology, their report would have shown that Massachusetts gained 1,438 life science jobs between 2009Q1 and 2013Q3. But the fact is their June 2014 report uses a different methodology from last year’s. What did they do that is different? And how does it lead to a significant jump in the number of jobs created in the life sciences sectors?
- They employed a new definition of “life science sectors” that excludes job loss four sectors. The four sectors in question lost 4,870 jobs over the period in question. These four sectors had been included in their definition of 16 life science sectors in their March 2013 report; in altering their March 2013 definition of the sector, their June 2014 report counted only 12 sectors, which saw stronger job growth, and dropped the four that lost 4,870 jobs.
- They included 5,689 jobs that had been added before the life science initiative began on Jan 1, 2009, in essence counting jobs that were created during a period preceding the focus (and title: “Massachusetts Life Science Employment: 2010-2012”) of their report. Oddly, the authors include data from 2006, four years before 2010 and three years before the 2009 effective date of the life science tax incentive program.
Their job calculations also did not account for 620 jobs that had been added in first 3 quarters of 2013, which were counted by Pioneer. Their report did not include 2013 data although it has been available for several months.
Other inconsistencies in “Massachusetts Life Science Employment: 2010-2012” include:
- The report claims that Massachusetts has 113,678 life science jobs. Considering that the 2013 Bluestone report calculated that there were 95,615 life science jobs in Massachusetts, the difference might suggest a giant leap in the sector’s employment. Closer inspection, however, shows that in the 2014 report Bluestone and Clayton-Matthews include two sectors that had been excluded from the 2013 report (hospitals and universities). The professors estimated that there are 21,219 life science employees working at Massachusetts colleges and universities. This number is more than twice as high as the estimate of 11,038 used by MassBiotechnology Council in its “2013 Industry Snapshot.” It is worth noting that in both reports the numbers are estimates. I raise this issue as the Bluestone/Clayton-Matthews’ estimate is not substantiated by facts and is twice as high as the estimates of industry representatives.
- Professors Bluestone and Clayton-Matthews cite the Current Employment Statistics CES-790 Employment series report as the source of their life science jobs number on a graph on page 5 of their report. It is worth noting that CES-790 does not report “life science” jobs numbers, nor does any federal agency, which is why there are debates over life science job numbers. While we understand that Bluestone and Clayton-Matthews include their own estimate of life science employment into the graph on page 5 for comparative purposes, it should be understood by readers and policymakers that the life science job figures did not come from CES-790. It is, again, an estimate by the authors of the report.
These are clarifications for readers and those writing on the topic. We share them because we want to provide facts about how numbers have been calculated by Pioneer and by others who are engaged in the public debate over the right path forward in making sure Massachusetts has world-class R&D sectors.
Yes, the life sciences initiative has been a bust if you measure it by the wild promises of 250,000 jobs that some proponents said would be created. It has not been a good investment at almost $1 million of public money spent per job created.
Before the state appropriates any more of the $1 billion life sciences initiative, it needs to better make sure that the investments are achieving the results promised. If not, the Commonwealth needs to have the courage to change course.
R&D-related sectors are a place where the Commonwealth has a comparative advantage. Pioneer wants to see more of these and other high-paying, knowledge-based jobs remain and grow in Massachusetts. R&D expenditures are in fact different from other business expenditures. They are incremental tax incentives that are triggered by increased R&D spending in-state. We need to think about them differently from a tax perspective. These tax treatments are not like giveaways to the film industry or favored industries.
So, to go back to the positive story, here are concrete ways to compete with California:
- We believe that all companies should be treated the same way if they are investing in R&D. More than two-thirds of Massachusetts R&D companies are not life science companies. Why should companies that are investing in R&D to drive the next generation of value-added manufacturing be excluded? Why not include IT companies? Why choose one sector over another as if the public sector has a track record of success in understanding global trends or has the expertise in all sectors to make that judgment?
- Pioneer has two very positive proposals in the paper that would put Massachusetts in a much better position to compete for R&D investments and perhaps gain more of the market share that California has cornered.
Gregory W. Sullivan is Pioneer’s research director, and a former State Representative and Inspector General for the Commonwealth of Massachusetts.

